I received the following interesting question regarding the Date Harvest Deep Dive video I did recently for the Enterprise DNA TV YouTube channel as part of the ongoing time intelligence series that @Melissa and I have been doing:

Billy is correct that the approach certainly is easier when you have an explicit evaluation context on date in the visual. However, for visuals that don’t contain this explicit evaluation context (e.g., cards, gauges, etc.), the approach absolutely still works – you just need to do a bit more work to build that evaluation context virtually within your measure and then apply [Inside Range] within the measure, rather than within the filter pane at the visual-level or page-level:
Virtual Inside =

VAR vTable =
ADDCOLUMNS(
    SUMMARIZE(
        Dates,
        Dates[Date]
    ),
    "@TotSales", [Total Sales],
    "@Inside", [Inside Range]
)

VAR TotalInside =
SUMX(
    vTable,
    [@TotSales] * [@Inside]
)

RETURN
TotalInside
Now the [Total Outside] measure is simply [Total Sales] – [Virtual Inside].
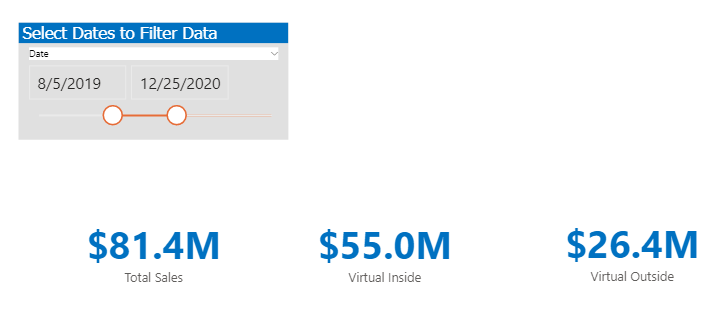
Here’s what it looks like all put together with card visuals, and of course the results are dynamic based on changes in the slicer:
Full solution file posted below.