From looking online it looks like you cannot put a measure on the x-axis of a chart. This kinda makes sense, however it would be good in some circumstances.
Can anyone help out with an idea for the following scenario. I’m showing measures on a chart.
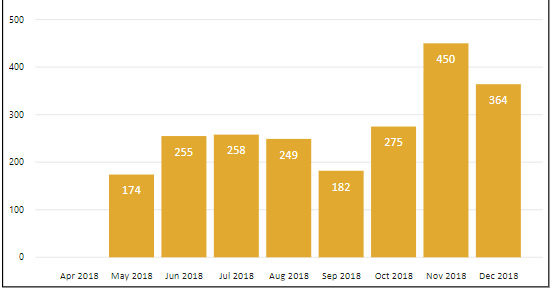
If the year is selected is a slicer, i want to show the Months on the X-Axis, if a month is selected in a slicer then show Day on the X-Axis.
I can to the logic for a measure using ISFILTERED(‘Date’[Month]).
The backup solution is to live with it and use drill down, but i’m trying to have the charts more dynamic.
I’m just not sure there’s an easy solution here. This is a common request I’ve seen a few times now.
This was a recent one I replied to
There is a solution contain within this one. It does make it possible to complete something like this but it’s quite complicated I have to say.
My personal recommendation (and how I always do it) is to not have the month slicer at all on the page. Make the user select within the month and year chart to select the month/s. Then have another chart that shows the results by day that get filtered with any selection. I personally feel this always looks great.