Good Day all,
I need a nudge in the right direction to solve a problem with what should be a very simple calculation.
Some set up information:
My report uses two slicers, Company and Location and a filter on all pages to limit the year to 2020.
I have been asked to add work hours and overtime analysis to my report.
Time card data is held in an SQL server table and I have added it to my data model as shown below. I consider it essentially the same as the HR Actions table as it will contain data for some of the employees in the employee table, but not all.
I Then created the following measures:
Total Hours = SUM(Timecard[HOURS])
Work Hours =// description column only has data for non-worked hours, i.e. vacation / leave
CALCULATE([Total Hours],
Timecard[DESCRIPTION] = BLANK()
)
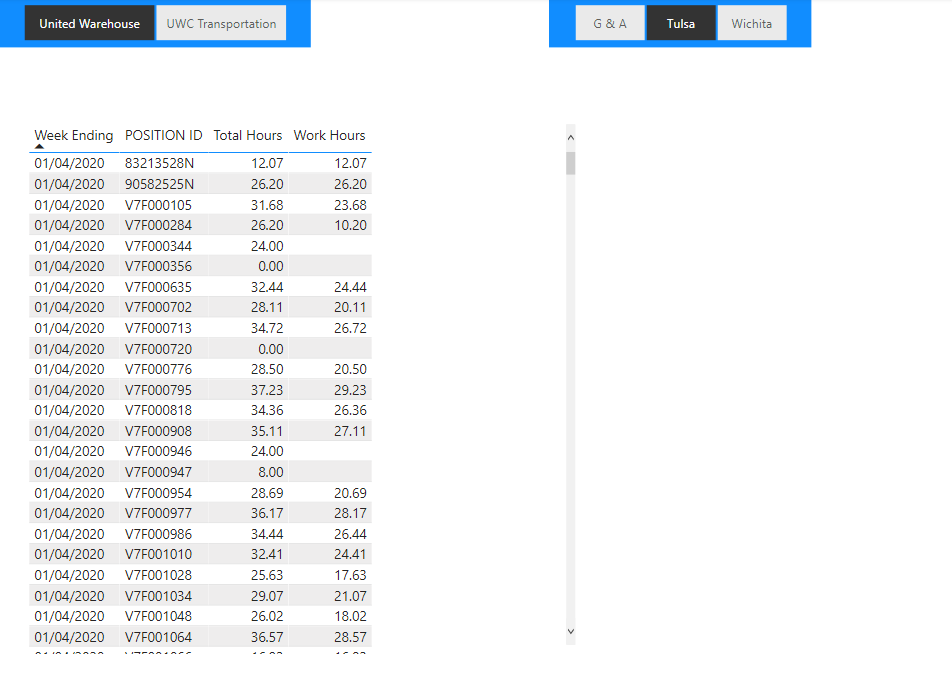
As I was creating the measures, I used a table to display the results and tested my slicers against the data and all was working great. The table was correctly filtered with all combinations of the slicers.
Obviously next I needed to calculate overtime on a weekly basis. As weekending date was present in my dates calendar, and overtime is calculated on a weekly basis I placed the week ending date in the table and dropped the below calculation into the table visual to calculate weekly overtime.
Overtime Hours =
IF([Work Hours] > 40,
[Work Hours] - 40,
0
)
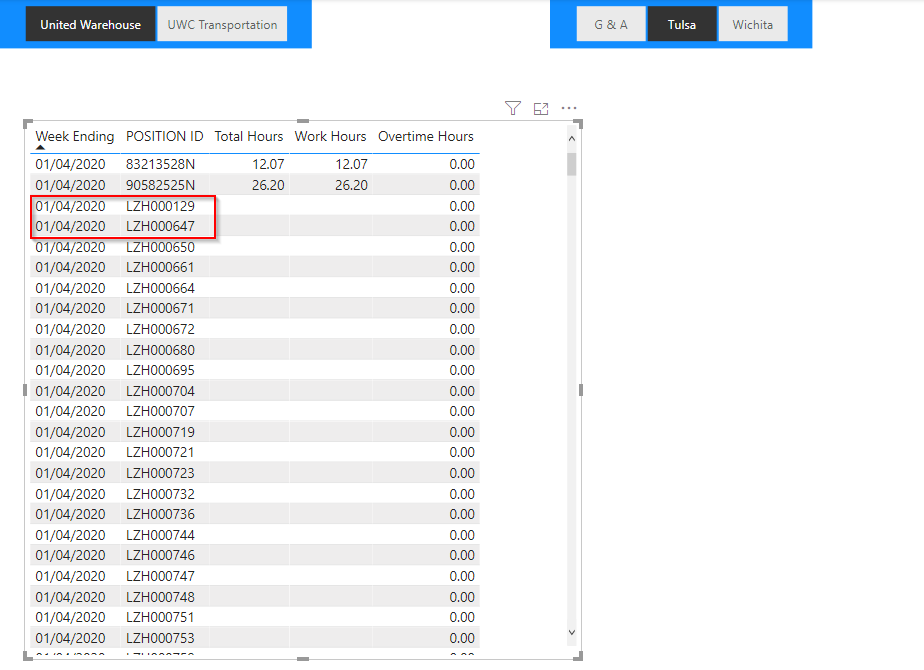
When I place this formula in the table, all of the slicers cease to function correctly and I do not understand why. The Position ID’s that are “correct” have results in the measures, incorrect position ID’s are all blank for the measures.
I feel I am missing something fundamental…but I just don’t see it. Can someone point me towards a topic or tutorial that can help me understand why this is happening?
HI Jamie. Your formulae look mostly correct, but if you use BLANK() instead of 0 in the [Overtime Hours] measure I’m guessing you’ll get what you want. Here’s a small sample I whipped-up. Hope it helps. Greg
Hi Melissa,
Thank you! That makes sense as to why blank() in the If statement removed the correct rows from the table. I remember that setting now that you have pointed it out to me…I won’t forget it again!
I am still confused and must not have a clear understanding of context. I will be reviewing anything I can find on that subject shortly.
I expected that when I selected United Warehouse (company) and Tulsa (location) in the Slicers it would filter the employees available to the table visual and the measures would only be applied to those employees.
Instead, employees from both companies and all locations appeared which made me immediately think I had an issue in my relationships. Changing to blank() appears to have filtered the results out of the visual effectively, but what I don’t understand is how they were available to the visual at all given the slicer settings and the waterfall flow of my relationships.
I’m still missing something, but eventually it will click and I’ll be the better for it! That, or I’ll have less hair than I already do and invest more in hats!
Hi Jamie. The data model is probably the culprit; the relationship (I’m guessing) order is a Company has several Locations, and a Location has several employees. My mock-up of earlier today didn’t have these relationships, but I expect they (should) exist in your model. Hope this helps. Greg
(If you can share a PBIX [with sanitized data, if necessary] I’ll be happy to pursue further.)
Hi Greg,
Thank you so much for the offer. I started off with a really horrible model, trust me…@BrianJ pointed me to that in my first post and I’ve tried to think through more thoroughly and have rebuilt it to what it is today. Certainly not perfect I’m sure and I’m happy to learn how to improve it. I’m limited by what data is provided me by HR, of course.
Here is my pbix HRKPI.pbix (985.3 KB)
I’m actually working through additional calculations on it now.
Our organization has two “sister” companies…each company has operations in each city (location).
The goal is to be able to select a city and filter the employees table which in turn filters the 3 related fact tables HC_Need / Timecard / HR_Actions. Location also serves to categorize salaried management that applies to both locations as a seperate “location” of G&A as data points for this group are not applicable to a single facility/location.
The source of all the dimensions above employees is the census file in stage queries That was provided by my HR department. I get termination files monthly and timecard files bi-weekly.
If you need additional information, please don’t hesitate to ask…and all criticism received constructively!
You’ve got yourself a bit of complexity here, what with some management employees booking time for more that one location/department. I wasn’t able to get a clear picture of the data model, but tried anyway and re-positioned the [Companies] table above the [Departments] table (i.e., [Companies] 1-* [Departments] 1-* [Employees] 1-* [Timecard]), but I think it still falls down for the [G & A] as you mentioned.
The 3 fact tables add complexity too, as I’m guessing you want to use the [Overtime] recorded to select/justify the HC_Need. I wonder if you could duplicate your report and use the one we’re analyzing here just for [Timecard], and the duplicate for HR needs and actions, that this might make the solution easier to visualize.
I think perhaps if you can get to a simpler snowflake-type of data model [i.e., lookup tables 1-to-many fact tables, and no links between fact tables] the solution might just come naturally. I’ve spent many years in the data warehouse and ETL worlds, and when I can’t see the model clearly and easily, I often fall back to a simpler program (e.g., Visio, PowerPoint, etc.) to try to flowchart the model I want; perhaps it could help.
Sorry I couldn’t be more help. I’ve attached my mark-up PBIX file in case it helps.
Greg
Hi Greg,
No need to be sorry at all, I’m very much appreciative of the effort you put in. Way more than I would expect.
I will take your advice and break this down into single pieces. In truth, that is what I did with the HcNeed and HRActions sections. I started with HR Actions and current staff calculations…got them working, added in the head count need to that structure, and then got asked to incorporate the overtime. The purpose of which I should have seen coming…as you are right, it is to compare to OT and justify the need.
Again, very much appreciate your efforts and I will certainly review your file and proceed.