Isolate blank Customer Sales

Hi,

I’m trying to calculate my total Customer Sales for the month and having multiple No Sales Customers:

Sales = DIVIDE( [Revenue 000’s], 1000)

All Customers = COUNTROWS( ALL( ‘Ship-To Party’[Ship-To Party (Key)]))

Total Customers = DISTINCTCOUNT( ‘Ship-To Party’[Ship-To Party (Key)] )

Factual data is coming from SPP CS Reallocation table with relationship to Ship-To Dimension table based upon Ship-To, see below:

image

Any support here isolating the No Sales Customers will be highly appreciated.

Thanks a lot,
Samuel

@SamSPAIN,

When you say “isolate” do you mean “not show” or “separate for additional analysis”? If the former, the easiest way to do this is in the Filter Pane - set your Sales measure to “is not blank” for the relevant visual, per the screenshot below:

image

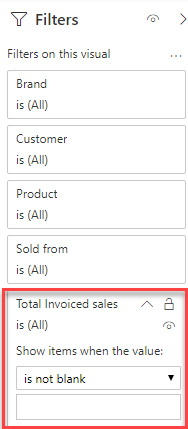
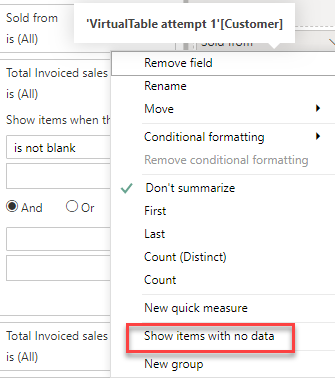
Also be sure to leave “Show items with no data” unchecked.

image

  • Brian

HI @BrianJ, I was referring indeed to no show these 0$ Customer Sales (exclude them) which I can’t do following your advice since Sales is made of different revenue natures and things gets even more complicated because I might have gotten Revenue on Freight but not on Others/Products/Services, so again I cannot use any of them actually. That’s the reason why I need to grab all Revenue natures and then somehow exclude Customers 0$ Sales.

Sales = DIVIDE( [Revenue 000’s], 1000)

Revenue 000’s = SUM(‘SPP CS reallocation’[Revenue on Products (Monthly average rate)]) + SUM(‘SPP CS reallocation’[Revenue on Services (Monthly average rate)]) + SUM(‘SPP CS reallocation’[Revenue on Freight (Monthly average rate)]) + SUM(‘SPP CS reallocation’[Revenue Others (Monthly average rate)])

@SamSPAIN,

If you can please post your PBIX, I’ll take another shot at it after looking a the full data model, data, measures, etc.

  • Brian

Sales Mgt PBIX extraction.xlsx (3.1 MB)

@BrianJ, can’t post the PBIX (84MB) as I can’t to shrink its size - data coming from SAP BW for which I don’t have access to, so essentially if I go to the Query Editor it will crash.

What I just did was to extract SPP CS Reallocation (Sales Fact table) filtered to Jan 22nd, as well as Ship-To Party (Customer Dimension table).

I tried to bring this Excel file to PBI but had issues committing Ship-To Party data, so unfortunately I can’t replicate the formulas that are shown below:

Revenue 000’s = SUM(‘SPP CS reallocation’[Revenue on Products (Monthly average rate)]) + SUM(‘SPP CS reallocation’[Revenue on Services (Monthly average rate)]) + SUM(‘SPP CS reallocation’[Revenue on Freight (Monthly average rate)]) + SUM(‘SPP CS reallocation’[Revenue Others (Monthly average rate)])

Sales = DIVIDE( [Revenue 000’s], 1000)

.
Just a thought. So if you can’t filter directly on [Customers 0$ Sales], are you able to create another measure with some ‘additional’ logic to identify them? If so - you could use that measure inside the filter pane to exclude them…

@Melissa, @SamSPAIN,

Exactly what I was thinking. I was working up the attached example at the same time you were posting above. I’ve replicated @SamSPAIN’s revenue measures and sales measure, and then created the following two measures, the first to mark and the second to count the No Sale customers:

No Sale Customers = 

SWITCH( TRUE(),
    [Sales] = BLANK(), 1,
    [Sales] = 0, 1,
    0
)

Count No Sale Customers = 

VAR vTable =
ADDCOLUMNS(
    SUMMARIZE(
        ALLSELECTED( Dates[Date] ),
        Dates[Date]
    ),
    "TotSales", [Sales],
    "NoSale",  [No Sale Customers]
)

RETURN
CALCULATE(
    SUMX(
        vTable,
        [NoSale]
    ),
    ALLSELECTED( Dates[Date] )
)

Here it is all put together:

Then in your filter pane, you can filter out [No Sale Customers] = 1

Hope this is helpful. Full solution file attached below.

1 Like

Hi @BrianJ,

First off, big thanks! This is working fine, however, when I’m bringing No Sale to visual filers it doesn’t let me select the filter option - would you know why is that?

image

Moreover, I was doing an Industry Segmentation based on Sales whereby I saw Sales not framed up within the specified Categories - see below:

Industry information is visible within the Excel I attached - Ship-To Party tab

Once more, thanks you very much indeed for your continuing support.

Cheers

@SamSPAIN,

So, when you hit the drop down arrow, it doesn’t give you the following options?:

image

If not, what happens if you keep the “is less than” option, enter 1 in the value box below that and then click on “Apply filter”?

Per your other question, it may be tied to the problem you are having above. or you could try filtering at the page level if this is happening in a different visual.

Sorry I can’t be more specific - it’s difficult to diagnose these quirky types of problems based on screenshots only.

  • Brian