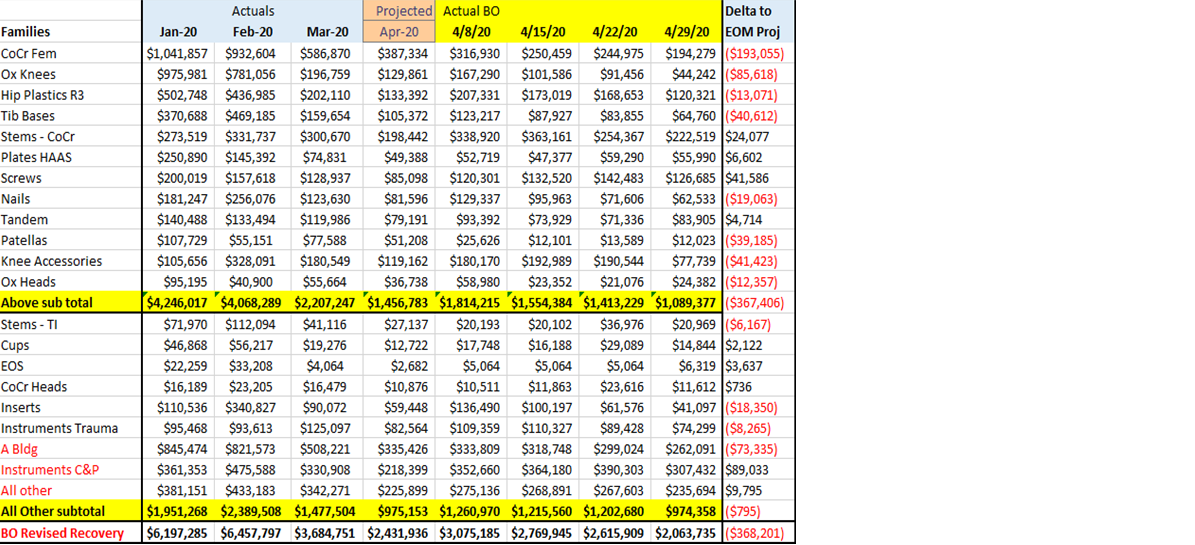
I have a requirement to group the values into above and below categories of Product Families and dynamically display values for current and previous 4 weeks… Also the Month & Quarters
My Datasource is SQL Server … I tried to use Groups within PowerBI desktop and it has a limitation of 10 groups where as I have more families to display …
I need to display two groups with their subtotals… within these groups I further need to group values for example anything that starts with A should go to “A Bldg” and any family that is not shown in the Matrix should be grouped as “All other”
Power BI is not the same as Excel, trying to replicate an ‘old’ but familiar Excel report can be challenging at times. So it can help to manage expectations, addressing the differences between the two tools early on. Non the less there are several techniques that combined will get you pretty close - I think.
For the Column Headers review this post.
And for the Grouping + All Other row dive into the Financial reporting section within the resources. There are many forum topics on this subject, you can use the Search option, to explore those…
If, after reviewing the content, you need further assistance please review the forum guides on what you can do to help other members get involved and help you work towards a solution. Thanks!
Thanks for reply! I have been able to get the matrix layout
I did create a custom column at PowerQuery by categorizing/labelling the values. I have then created Groups inside reporting layer and put them inside Matrix…
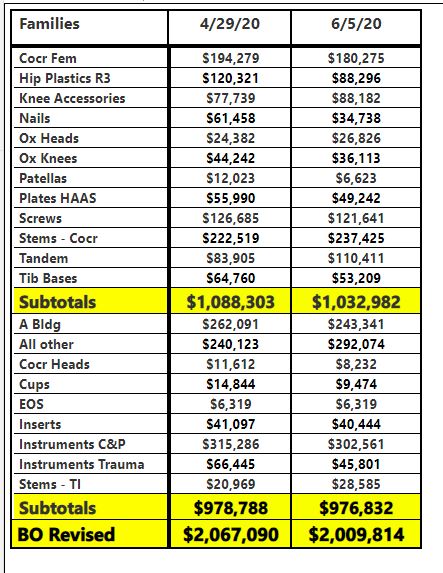
Now my challenge is to dynamically change columns to produce a view displaying weeks for current month and then Month level data for previous months
My Sql table has only got loaded date and year_week columns … any hacks and suggestions please throw at me
@yendluru.aj can I assume you’ve incorporated a Date dimension table in your Model?
Because if that is the case dive into the Time Intelligence module within the resources and the first topic referenced in the previous post with the title ‘using two date tables to do analysis’