Matrix report- How can I keep the same template as Excel

Hi All,

I need to move the Excel report in Power BI and keep the same template.

I populated the data into Power Bi. Then, 2021 & 2022 data can show the same as in Excel. The growth % could not achieve the Excel format.


test.pbix (117.2 KB)
Power BI vs Excel.xlsx (106.8 KB)

Thanks in advance
Jess1

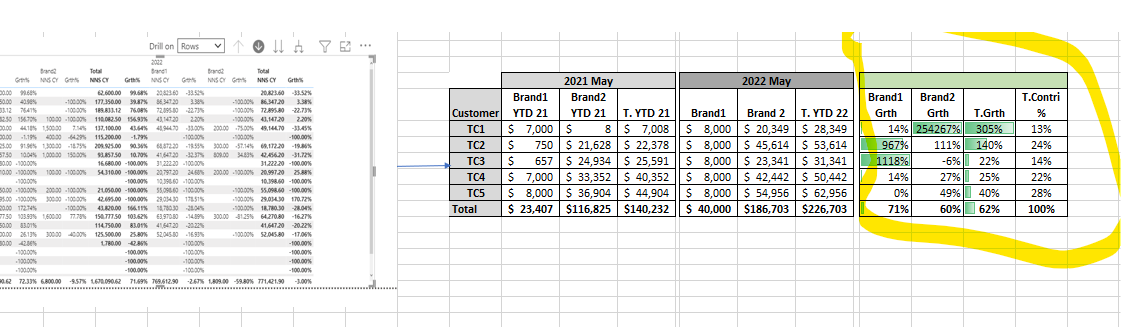
The problem you are having is that a Matrix table is just like a Pivot table in Excel - and you would not be able to easily achieve what you are looking for with an Excel pivot table.

if you must have this type of layout (although I recommend rethinking your solution - or consider moving your report into Excel Power Query if you must have an Excel layout)

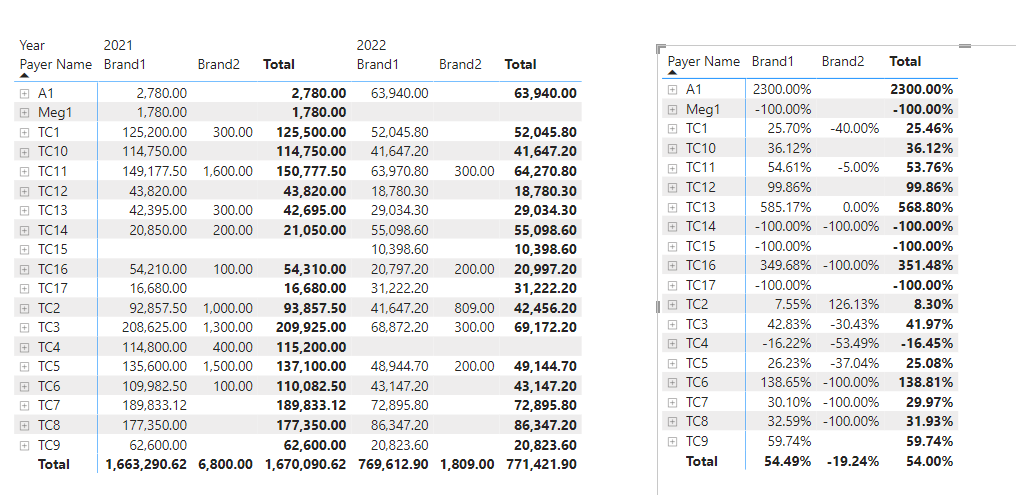
My suggestion for a potential solution is two Matrix tables:

and to control the Grwth % visual - you’ll need to filter that to not include rows where the NNS values for both periods is blank:
filter Grth % =

= IF( [NNS CY] = BLANK(),
    0,
    1 )

and then use that to filter the visual:
image
eDNA Solution with Filter Measure.pbix (118.1 KB)

1 Like

Hi Heather,

Thanks for looking into this! I will take your suggestion.

1 Like