Hello @MalcolmJ,
Thank You for posting your query onto the Forum.
Well, by far this is the trickiest question I’ve ever faced onto the Forum. Let’s understand why the results are evaluated correctly in Power BI but when exported to Excel everything get’s blanked out. Let’s see this step-by-step to understand in a better manner -
1). This is the formula you’ve written for “Overlap” -
Overlap =
CALCULATE( DISTINCTCOUNT( 'Example Table'[Employee] ) ,
    FILTER( 'Example Table' ,
        [Σ Hours] <> 0 ) )
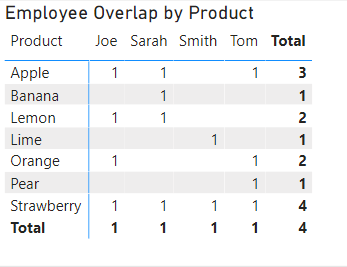
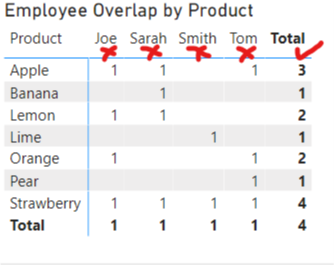
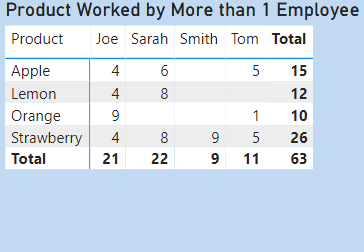
And based on that formula, this is the result you get. Below is the screenshot of the result provided for the reference -
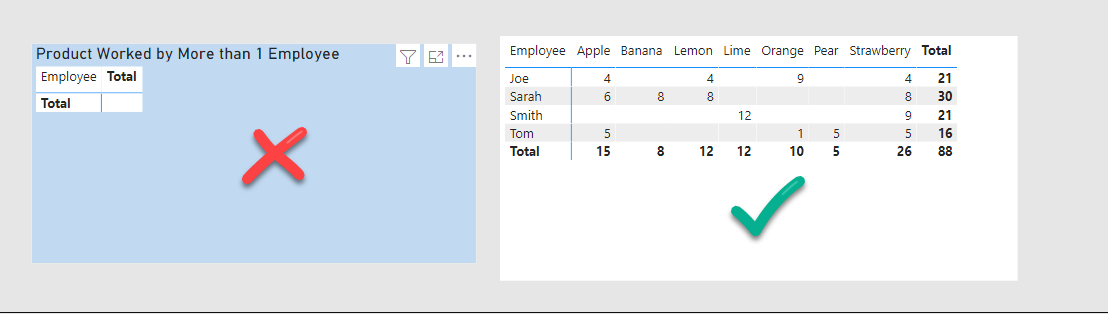
Now, based on this result you substituted the measure into the “FILTER PANE” stating the condition as “Overlap > 1”. And this is the final result you got. Below is the screenshot provided for the reference -
Up till now, everything was going absolutely great. And in normal circumstances, this is the correct approach I would say (since you harvested the measure into the FILTER PANE to get the results) but when you tried to export the data to the Excel file that’s where things started to go downhill.
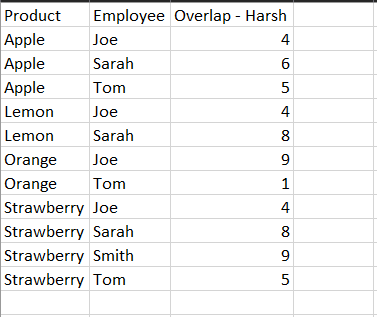
The reason why it gave blank is because at the back-end the context was evaluated like this. Below is the screenshot provided for the reference -
Now, you must be wondering how did this happened actually since at each and every step in Power BI you see the correct results. So now, if you remember, you inserted the condition under the FILTER PANE as “Overlap > 1”. This condition actually worked at a “Total Level” and not at a “Individual Item Level”. See how it actually worked and what it actually ignored. Below is the screenshot provided for the reference -
If you observe the above picture, Power BI at back-end was considering the “Total Level” and when we export the data into the Excel we don’t see any “Totals” over there rather we see individual line item results. So therefore, now you need to create a measure that actually considers individual line item context and not “Total Level” context.
2). Creating “Overlap” measure that works at a “Individual Line Item” context -
Overlap - Harsh =
DIVIDE(
    COUNTROWS( 'Example Table' ) ,
    CALCULATE( COUNTROWS( 'Example Table' ) , ALLSELECTED( 'Example Table'[Employee] ) ) ,
    0 )
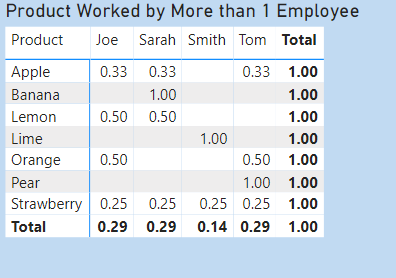
Now, if you see the results above. The “Figure of Every Row is divided by the Total Of That Row”. So for example, Apple has 3 observations so each observation is divided by the total i.e. 1/3 = 0.33. It actually a “Percentage” so overall result is 1.00 i.e. 100% and Apple is 0.33 each i.e. 0.33% each.
But now, the problem is you cannot put these directly into the “FILTER PANE” stating the condition as “Overlap < 1”. It will simply give you the results as “Blank”. Since technique only works at a total level. So now, you’ll be required to create a formula that actually filters out the employees who’ve actually worked on more than 1 product.
3). Create a formula to Find Out More Than 1 Employee Working onto the same Product -
Overlap - Harsh =
VAR _Hours_Calculation =
SUMX(
    'Example Table' ,
    'Example Table'[Hours] )

VAR _Distinct_Employees_Calculation =
DIVIDE(
    COUNTROWS( 'Example Table' ) ,
    CALCULATE( COUNTROWS( 'Example Table' ) ,
        ALLSELECTED( 'Example Table'[Employee] ) ) ,
    0 )

VAR _Results =
IF( _Distinct_Employees_Calculation < 1 ,
    _Hours_Calculation ,
    BLANK() )

RETURN
_Results
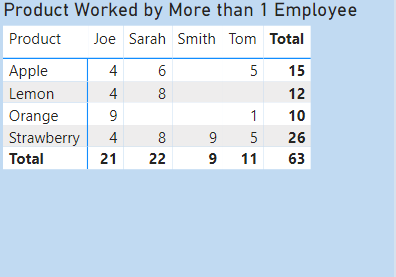
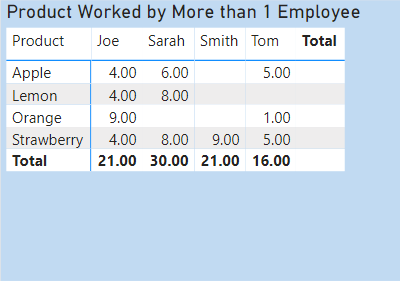
Now, if you see the results it actually filters out the records of only those employees who’ve worked on more than 1 product. Below is the screenshot provided for the reference -
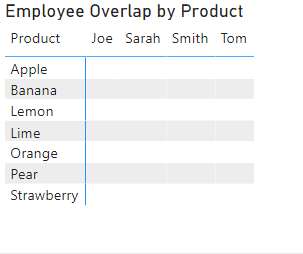
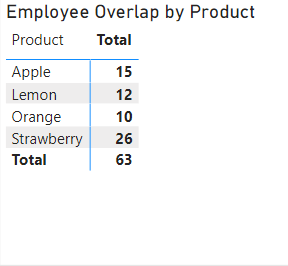
But the grand total is incorrect. Now, we might create a measure to fix the grand total results based on the post which @Greg had already created onto the Forum. But due to the condition specified into the measure as “BLANK()” the measure will only evaluate the results at a total level and will also skip the “Employees”. Overall see how the results will look like. Below is the screenshot provided for the reference -
Totals =
SUMX(
    SUMMARIZE(
        'Example Table' ,
        'Example Table'[Product] ,
        'Example Table'[Employee] ,
        "@Totals" ,
        [Overlap - Harsh] ) ,
    [@Totals]
)
So the reason why it’s ignoring “Employees” is because in a row there’re some blanks and some are not and due to “BLANK()” specified as a condition in the formula it ignoring entire row and therefore affecting the totals in it’s entirety.
So now here’s the “Trick”, just simply overlay the new table visual over the old one by using the following techniques.
4). Technique to Overlay New Table over Old One -
A). Select the New Table Visual, go to the “View” tab and select the “Selection” option.
B). Under the Layer Order menu, set the new visual as first priority and the old visual as second one and than group them together.
C). Turn-off the Background of the New Table visual.
D). Turn-off the Row and Column sub-totals of the New Table visual.
E). Finally, overlay the new one over the old.
This is how the final result will look like. Below is the screenshot provided for the reference -
You’ll see that correct individual as well as grand totals are visible.
5). Export Data to Excel -
Now, let’s try and see whether the the table visual exports the data correctly or not. Since this is what we’ve actually worked for. Below is the screenshot provided for the reference -
“Phew, finally, it does!!!”
I’m also attaching the working of the PBIX file for the reference so that you can have a close look at it.
Hoping you find this useful and meets your requirements that you’ve been looking for. 
Thanks and Warm Regards,
Harsh
Filter by Distinct Count Issue - Harsh.pbix (63.6 KB)