Hello @Nisha,
Thank You for posting your query onto the Forum.
This is one of the few example about how Filter Pane works in a bizarre manner. Let’s break the situation step-by-step about why the two results are different but the totals are still same.
1). Results Based On Filter Pane -
In this case, when you tried “Top 5 Products by Sales” using Filter Pane, it evaluated the context externally first over all the products which are in Top 5 for the entire year. The reason why this happened is because, it’s a normal behaviour of Filter Pane since it only takes into account only one single context.
For example, remove the “Quarter & Year” from the visual and replace it with “Product Name”. Below is the screenshot provided for the reference -
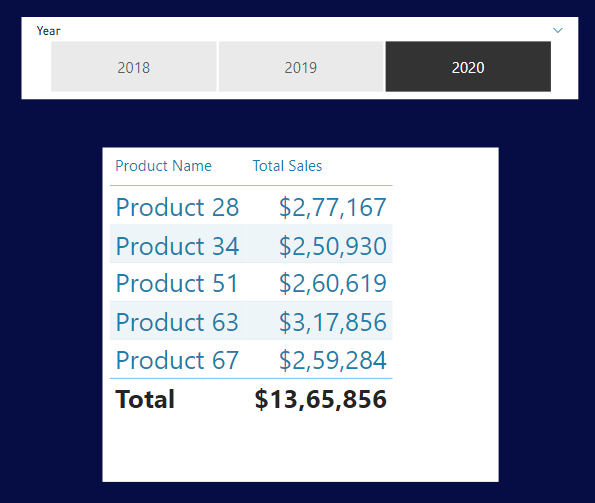
So once, it evaluated the results for Top 5 Products externally, inside the table visual it just bifurcated the results based on quarters for the selected year. At the back-end, this is how the results are evaluated. Below is the screenshot provided for the reference -
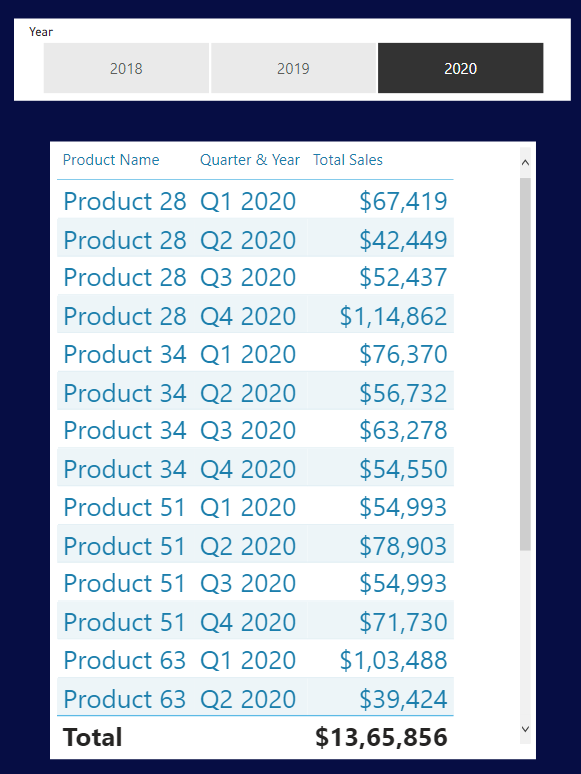
So in this scenario, external context took precedence over the internal context.
2). Results Based On Top N Measure -
In this case, the context was defined inside the measure i.e., Total Sales based on Top 5 Products. And now, when it’s brought inside the table visual it’s first evaluated by the internal context i.e., which are the Top 5 products in each particular quarter and THEN for that particular selected year.
Again, for example, remove the “Quarter & Year” from the visual and replace it with “Product Name”. Below is the screenshot provided for the reference -
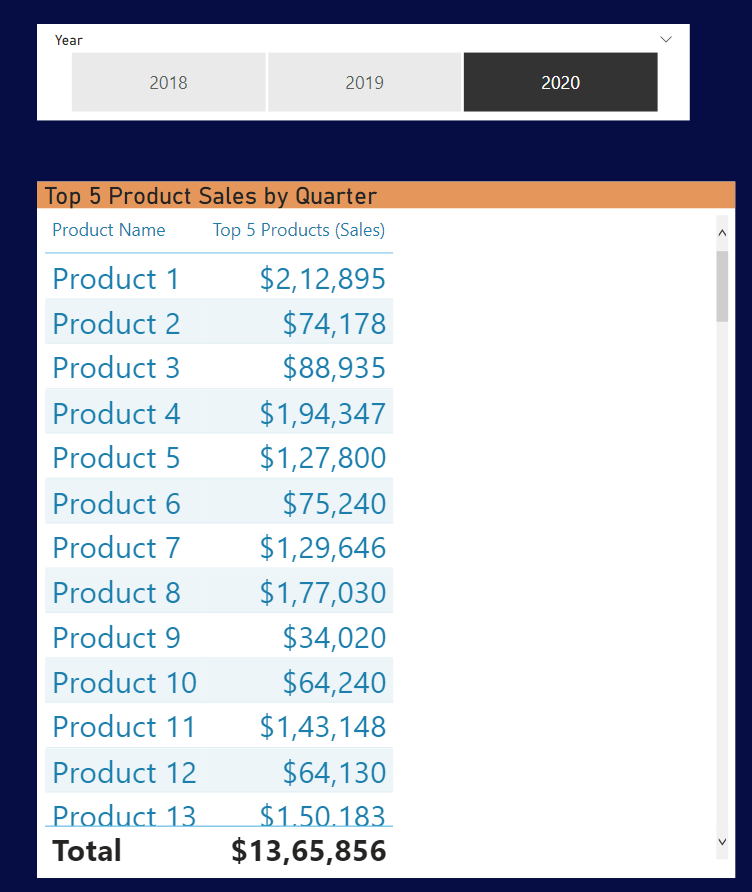
You’ll observe that it’s calculating the results for all the products and not for Top 5. But above I said, it’s evaluating it internally first. See how it evaluates the results at the back-end. Below is the screenshot provided for the reference -
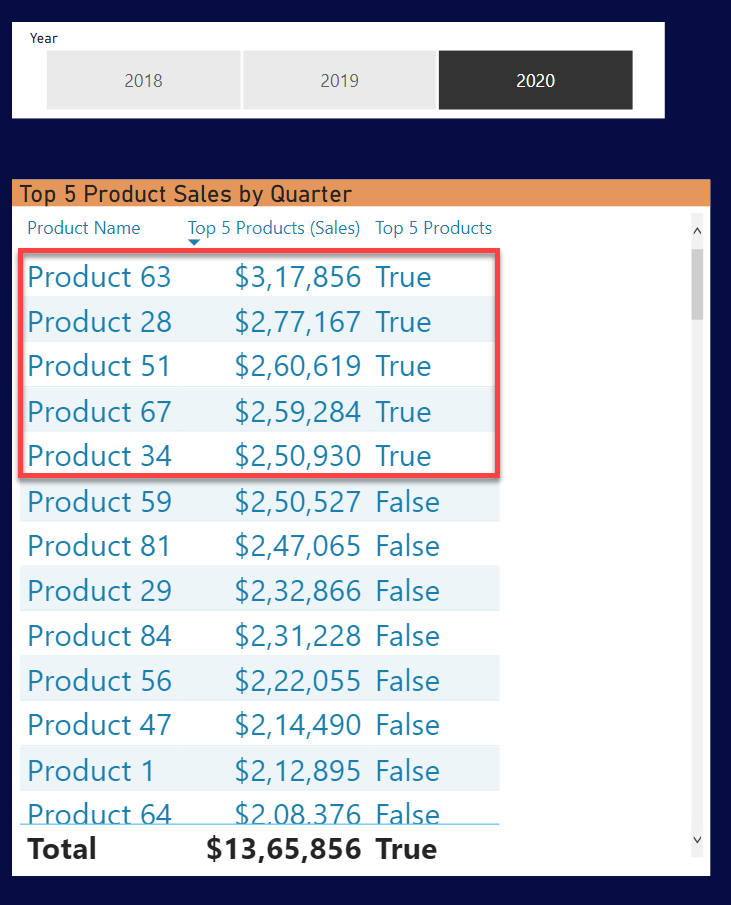
And that’s how, it evaluates the results internally. So now, when you again replace the “Product Name” with “Quarter & Year”. It calculates the Top 5 Products for each “Quarter & Year” rather than calculating it through-out.
So in this scenario, internal context took precedence over the external context.
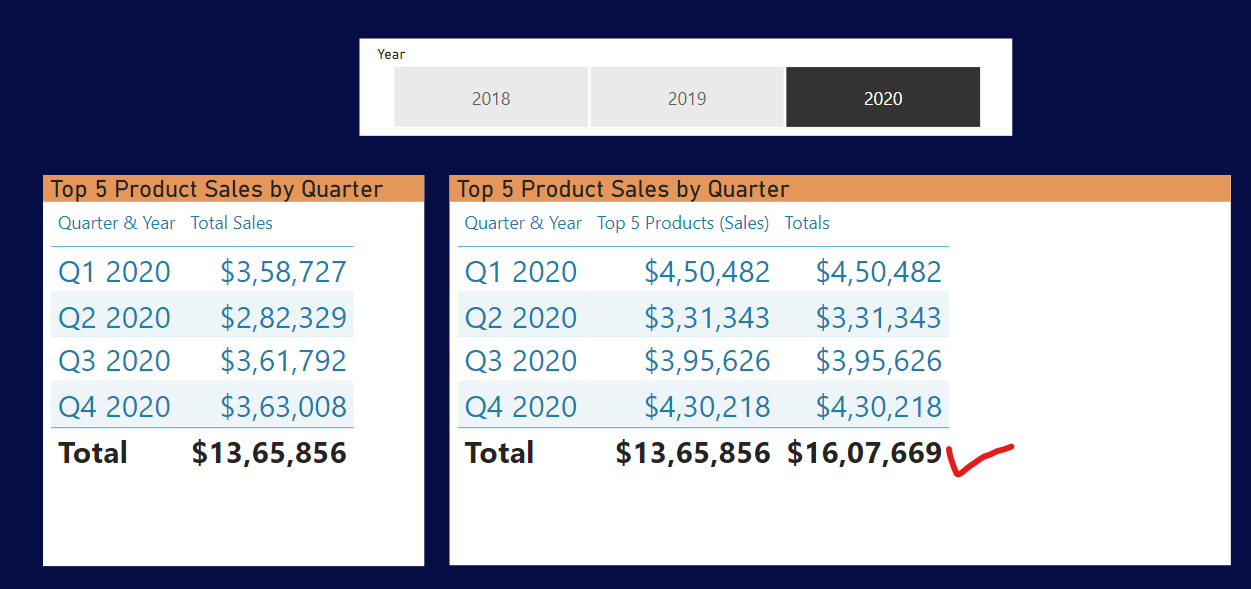
So finally, you must be wondering why Totals for both the tables are still same. The reason being is, for first scenario, it’s evaluated correctly but in the case of second instance, at an individual row level, it’s calculating Top 5 Products dynamically in a correct manner but what actually happens at a Total level is it again starts to evaluate the Top 5 Products for the entire year since there’s just no context available there. And that’s why, total is wrong. But one can easily fix it by writing the small simple measure -
Totals =
SUMX(
    SUMMARIZE(
        Dates ,
        Dates[Quarter & Year] ,
        "@Totals" ,
        [Top 5 Products (Sales)] ) ,
    [@Totals] )
I’m also providing a link of the post in case if you want to understand in-depth about how Filter Pane works differently.
Hoping you find this explanation helpful and clears all your doubts.
Thanks and Warm Regards,
Harsh