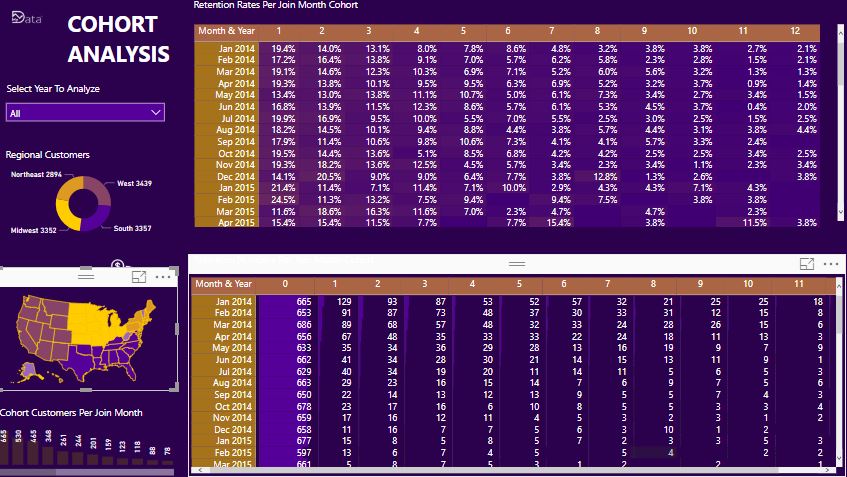
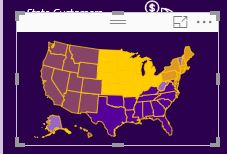
I’m asking for USA Map in Cohort analysis showcase, I tried to find which map visual you use in displaying (USA MAP) e.g.: Map, Filled Map,Esri,…etc , I want to do the same with another country (lat , lon) Particularly (Saudi Arabia) My Question is
Which map visual tool you use?
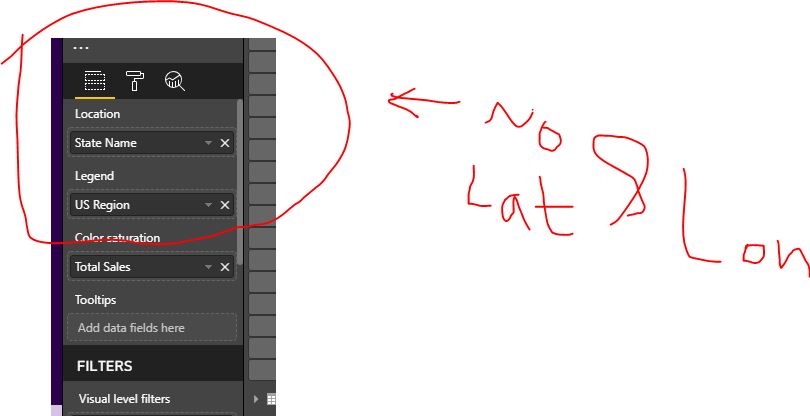
2)On this tool, I didn’t find (lat & lon) on it how the Map moves and go to a location without lat & lon?
The map visual used is a Shapemap, as you can tell when clicking the visual. Shapemap requires a vector based map, (so lat and lon are not required) a few have been added as defaults and you can add more files. Under Format, Shape you can select an available map or add a map. Search on google to obtain the *.shp file for your country of choice. There are several websites that provide a free conversion tool, you need to convert a *.shp file and *.dbf file to a geojson or topojson extension. It is a bit technical I am afraid. The map uses keys=your geographic datafield to connect your data with a similar key to the shape (key being a state or a province or postcode area) in the map.
Hi,
Please read carefully through the explanation, the map you referred to is a shape map, not a lat/lon map which show points on the map.
So you cannot use latitude and longitude for a shape map but instead you have to “create” the boundaries of the shapes like states or provinces. The 3 files I refer to hold the information to convert into a json file that can be read by the Power BI visual.
The shape map visual is already present in Power BI.
Paul
Thank You for your replay I understand now , But can you show me how to upload it (JOSON Boundaries) into PBIx file ?
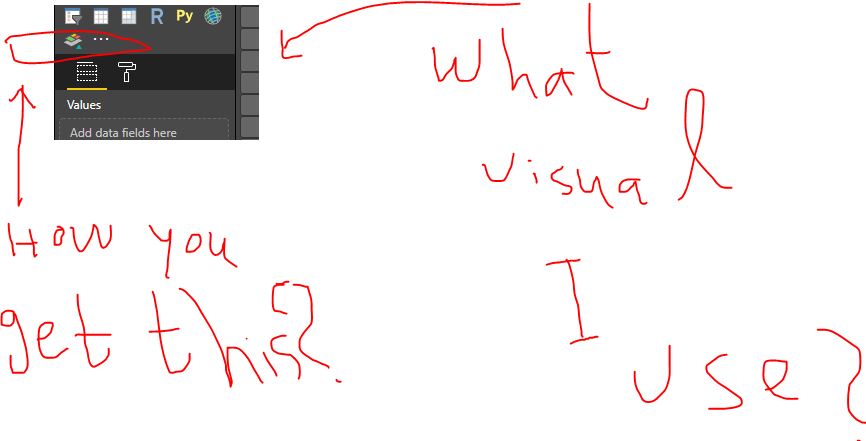
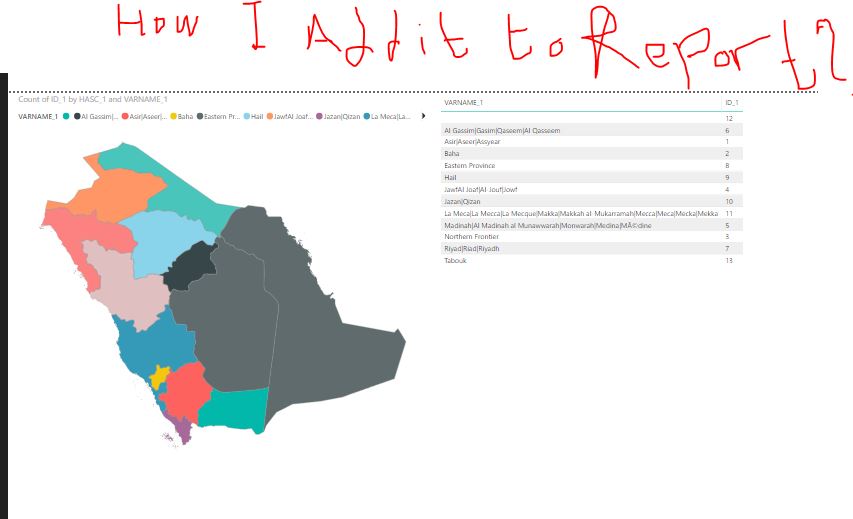
I mean I cannot find a custom visual that I can get the Joson file and convert it into map boundaries (Check My Images Below)?
I understand how to export it into Map boundaries file, Assuming that you didn’t send me the PBix file
I’m appreciated if you can show me how is that (Upload the Map Boundaries Into Power bi report) this is the missing point I didn’t know how to do it?
Hi,
ok. I am not behind my pc, but I recall you may have to manually activate this visual on first time use. Please check under options whether you have the shape map visual selected, once you have it should show.
Then follow the steps, hope this works for you now.