      I'm very new to Power BI and having some issues with the data locations being shown outside the intended countries of the data. I tried various techniques but still the data is being wrongly pointed outside the actual location.
               Please look into the issue and help me out with a correct solution
I have used lot of Online help videos like this. But still even after applying those suggestions my issue persists. Can I get any assisted help of my issue please.
You have a few issues with your dataset,
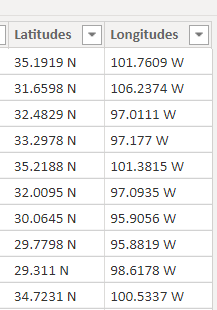
lat and lon need to be in decimal number format, so with a comma and without N or W.
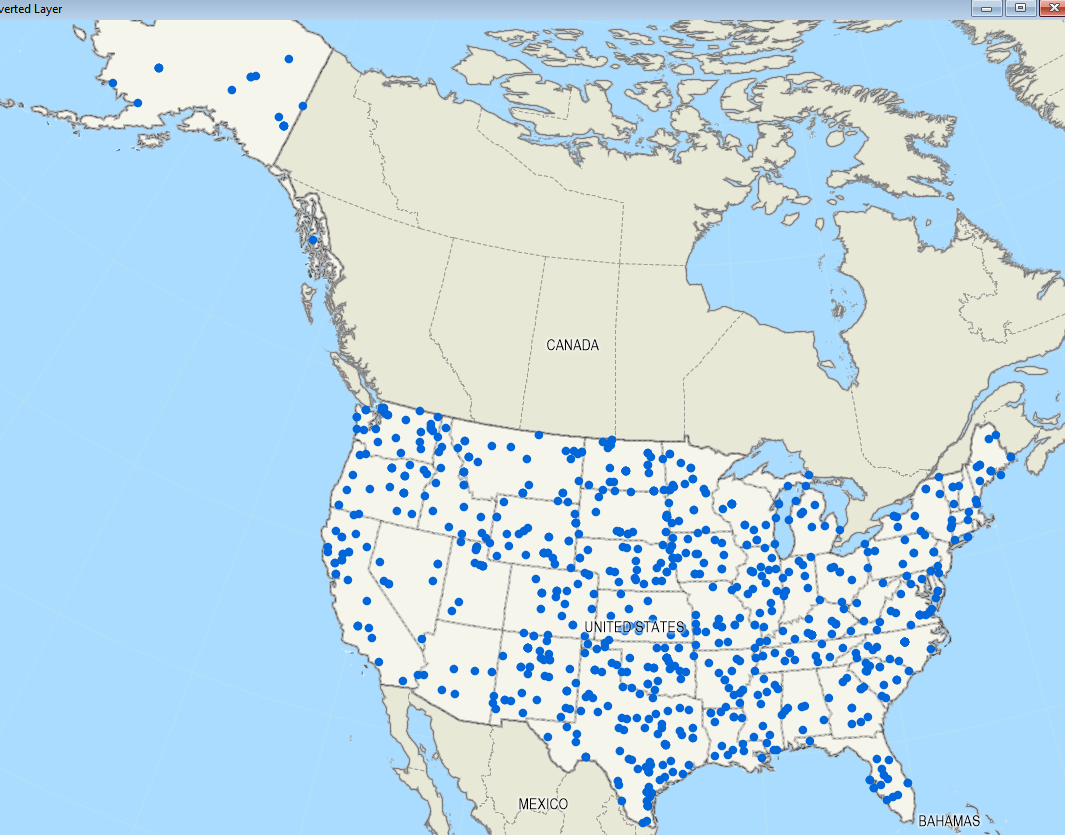
I mapped the 1038 addresses, (not the latitude/longitude) in a GIS application and some 800 were found and mapped in the US, see map.
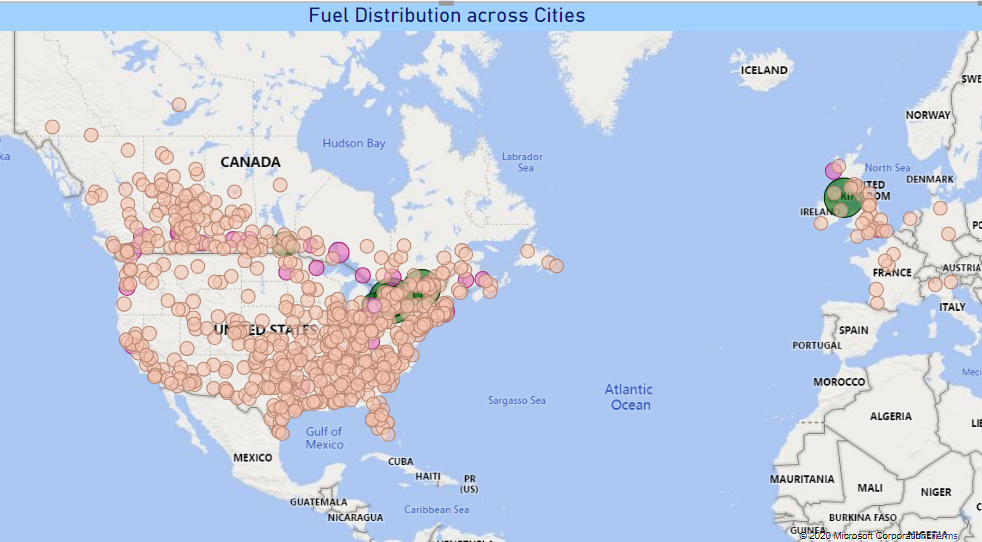
However, using the latitude longitude in your data I got them spread out across Europe, so it seems you have a geocoding issue.
How did you get the latlons? Once corrected remember, in Power BI Desktop to change the data category to lat lon respectively
   The Lat and Long are correctly marked in Power BI Desktop.
The Lat , Long are in decimal format. The lat, long are coming from the data base recorded as per the store locations, which I have checked online and it exactly matches .
When you say Geocoding issue? What do you mean by that and what needs to be done to address them. As I’m fairly new to Power BI, I’m learning things to understand and make it correct.
Any suggestions in the right direction is greatly appreciated.
Please respond in the appropriate window, currently you are sometimes typing text in a preformatted text window.
With the addition of N or W they cannot be in decimal format.
Basically in the background a mapping visual will convert the adress information into latitude and longitude and plot on a map.
Your records show a latitude and longitude, this means they have been geographically coded, which is the best way to map, so I assumed these to be correct but many are not.
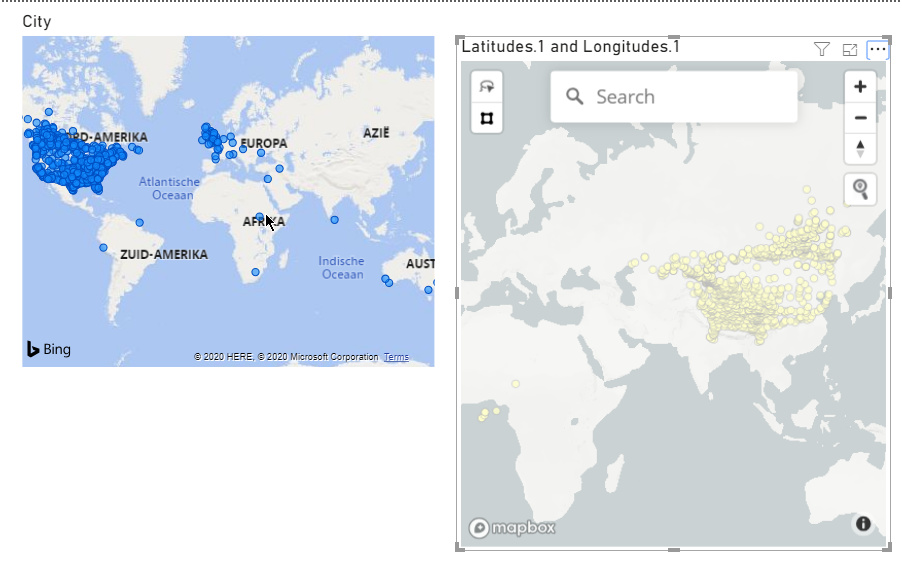
However, when I use your cities I get the city map shown next, blue dots,
when I map your latitude and longitude I get a totally different map, yellow dots.( I used Mapbox visual, which I find much better, available free in the AppStore), so it is likely something is wrong with the data.
I had a closer look at your data, to find that every records shows the same country and city in the column “City Country”
I have added a merged column “Location” in Power Query, with city and country separated by a comma. This mapped more accurately.
Hi @naresh, we’ve noticed that no response has been received from you since the 10th of February. We just want to check if you still need further help with this post? In case there won’t be any activity on it in the next few days, we’ll be tagging this post as Solved. If you have a follow question or concern related to this topic, please remove the Solution tag first by clicking the three dots beside Reply and then untick the checkbox. Thanks!
        My apologies for not replying as I'm currently to a different location of Company's work.
  The issue isn't resolved yet as I'm unable to plot them correctly as per their exact geographic location.
        As I'm completely new to Power BI, I'm finding it a bit challenging to make it right. Further assistance would be of great help
First of all please do not respond in the box you are currently using, this is meant for formula’s.
I am reading this on an Ipad and it should be 40” wide to read the text without scrolling to the right
Mapping can be a bit of a pain every now and then.
Given that you seem to have correct addresses, although in your data you only show city and country (USA) , for accurately plotting, you need to add an address. Check out an online geocoding service, check https://www.geocod.io/how-to-geocode-addresses-in-excel/
There are many more websites offering this service, came across this one recently, you can do 2500 records free per day.
Once geocoded mapping should be a breeze.
So, mapping right on the door step requires full addres information, mapping by city name takes the latitude/longitude to the centroid (sort of midpoint) of the city which is ok for visualisation but not for more advanced requirements.
To the contributors of this post, thank you for all your inputs on this topic we are now tagging it as Solved. To help us learn more about your experience in the forum, please take a moment to answer this short forum survey. We appreciate all your help and suggestions. Thanks!