I have employee wise mobilization & demobilization dates. I want month wise spread based these dates.
Expected output mentioned in attached file.
Thanks in advance.
Manpower Spread.xlsx (12.5 KB)
I have employee wise mobilization & demobilization dates. I want month wise spread based these dates.
Expected output mentioned in attached file.
Thanks in advance.
Manpower Spread.xlsx (12.5 KB)
Hello @prafullchavan1,
Thank You for posting your query onto the Forum.
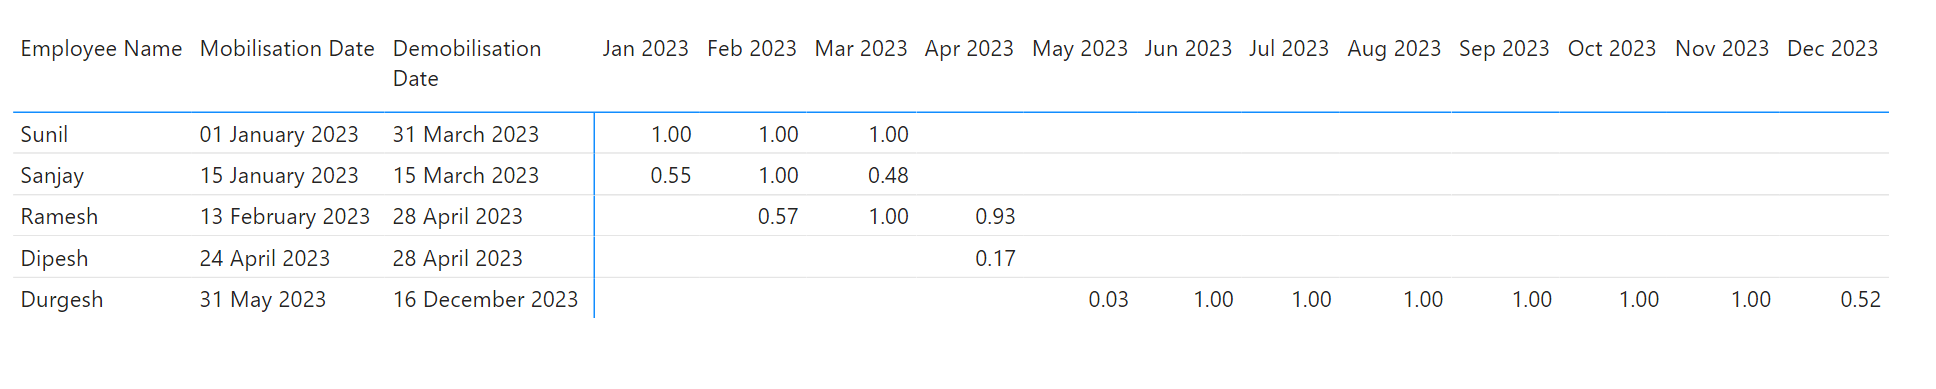
In order to achieve the results based on the scenario that you’ve mentioned. Below is the DAX measure alongwith the screenshot of the final results provided -
Distribution of Manpower Days =
VAR _vTable =
SUMMARIZE(
    Data ,
    Data[Employee Name] ,
    Data[Mobilisation Date] ,
    Data[Demobilisation Date] )

VAR _No_Of_Rows =
COUNTROWS(
    FILTER(
        CROSSJOIN(
            VALUES( Dates[Date] ) ,
            _vTable ) ,
        Dates[Date] >= Data[Mobilisation Date] &&
        Dates[Date] <= Data[Demobilisation Date] ) )

VAR _No_Of_Days_In_Months =
COUNTROWS( Dates )

VAR _Results =
DIVIDE(
    _No_Of_Rows ,
    _No_Of_Days_In_Months )

RETURN
_Results
I’m also attaching the working of the PBIX file for the reference purposes.
Hoping you find this useful and meets your requirements that you’ve been looking for.
Important Note:-
In the Excel file, for Durgesh in the last month i.e., in Dec 2023, you’ve calculated or showcased a figure as 0.48 which is incorrect while the correct figure is 0.52. That is, 16 Worked Days divided by 31 Total Working Days In A Month equates to 0.52. Please check and verify.
Thanks and Warm Regards,
Harsh
Thank You Very Much
When I add Total on rows
it doesnt shows correct value.
Hello @prafullchavan1,
Create one more measure which fixes totals. Like this -
Dist. of Manpower Days - Total =
VAR _Cross_Join =
CROSSJOIN(
    SUMMARIZE(
        Data ,
        Employees[Employee Name] ,
        Data[Mobilisation Date] ,
        Data[Demobilisation Date] ) ,
    VALUES( Dates[Month & Year] ) )

VAR _vTable =
ADDCOLUMNS(
    _Cross_Join ,
    "@Totals" ,
    [Distribution of Manpower Days] )

VAR _Filtered_Table =
FILTER(
    _vTable ,
    NOT ISBLANK( [@Totals] ) )

VAR _Results =
SUMX(
    _Filtered_Table ,
    [@Totals] )

RETURN
_Results
PBIX file attached.
Thanks and Warm Regards,
Harsh
Proportional Distribution of Dates - Harsh v2.pbix (72.6 KB)
Hello @prafullchavan1
Did the response from @Harsh help solve your query?
If not, can you let us know where you’re stuck and what additional assistance you need?
If it did, please mark his answer as the SOLUTION.
Thank you
Total on rows are not showing correct.
I need help to resolve this issue.
Hello @prafullchavan1,
I already sent a revised file with a additional measure in it which fixed the totals on both i.e., rows and columns.
If it’s still not fixing the problem for you then why don’t you attach the PBIX file for the reference purposes. How will the members come to know who are providing assistance onto the Forum that what’s working and not working for you?
Without PBIX file, it just un-necessarily wastes the time of the other Forum members who’re providing assistance onto the Forum in guessing work and also prolongs the thread with un-neccessary information who is then referenced by other members in future for their use case.
Attach the PBIX file in order to receive any further assistance.
Thanks and Warm Regards,
Harsh
I apologise to you.
But I wasn’t able to see your revised solution. Not sure about reason.
Today, I can see you replied 5 days ago.
Actually, We prefer to use MS Excel so that this solution can be used by our team.
In future, I will ensure to upload .pbix file.
Sorry for your inconvenience .