Hello guys, I hope you are doing well. I would like to know if you could recommend me some content that allows me to make dax measures with which I can iterate. But I haven’t really been able to, this is something so simple in Excel that I’ve literally been at it for 5 days and I haven’t been able to figure it out.
This article is the closest I have found but it is at the calculated column level.
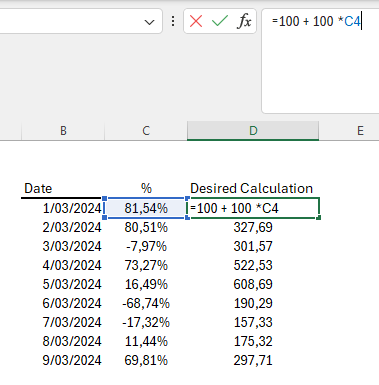
The calculation that I need is the following →
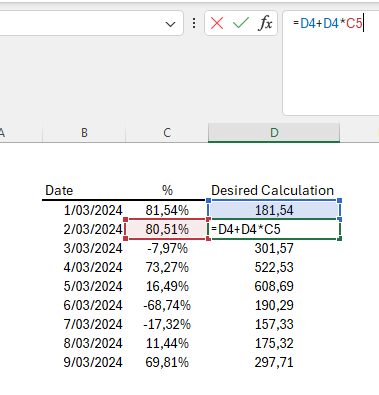
The first value begins with 100
The second value depends of the result of previous value
This is the excel file if you want to evaluate. iteration.xlsx (9.8 KB)
The idea is to use this calculation in a table visual.
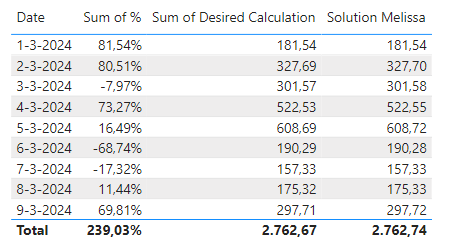
I’m sure, however the cause had a different origin and was even easier to fix. When I copied your sample from Excel into Power BI, your PCT was shown with only two digits. Once I made all digits visible before copying, the results matched your expected outcome.
You should not have experienced this with your own data, therefore my suggestion is to double check if you have all digits there…