I originally had this thread in the DAX area but @Harsh tells me its a Modeling issue thus Im have to post here for help.
What i want to do is create a switch or if statement that if a staff member is clocked in SAP on a different project than their own i want to know.
The Project Number, Project description and Area from filter table Headcount have to match the Project Number, Project description from filter table Materials & Projects and then have another column that says Yes or no in the visualization.
Im told my model is not set up correctly but i don’t understand why Im afraid despite reading all the documents Harsh sent me.
Can one of you fine people tell me where Im going wrong here and adjust the PBIX so i can see what you did to fix the issue?
The measure logic I sent you yesterday should work here (see below). I haven’t had time to delve into the modeling discussion that you and Harsh had yesterday, but it does give me significant pause that you’re slicing on your fact table in order to compare your dimension tables.
I am jammed up in meetings all day today, so hopefully someone can help you revisit the modeling issues, or I can take a look later tonight. I hope this is helpful.
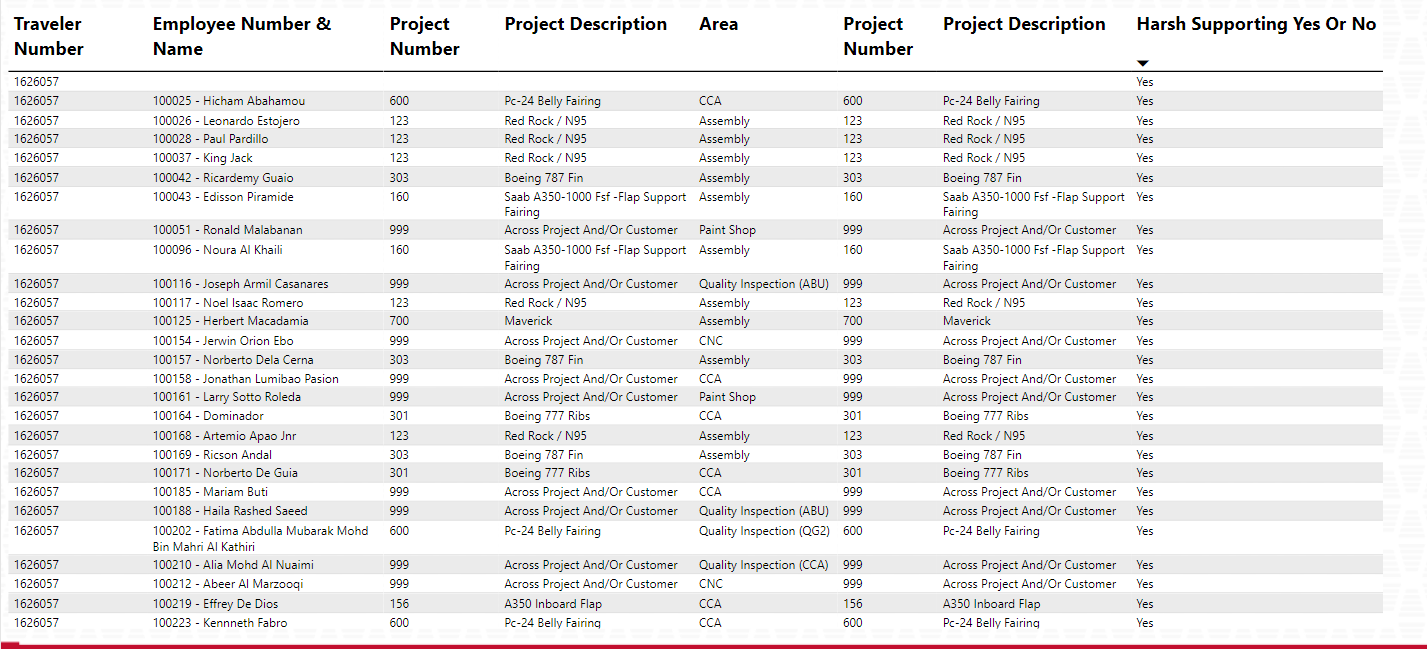
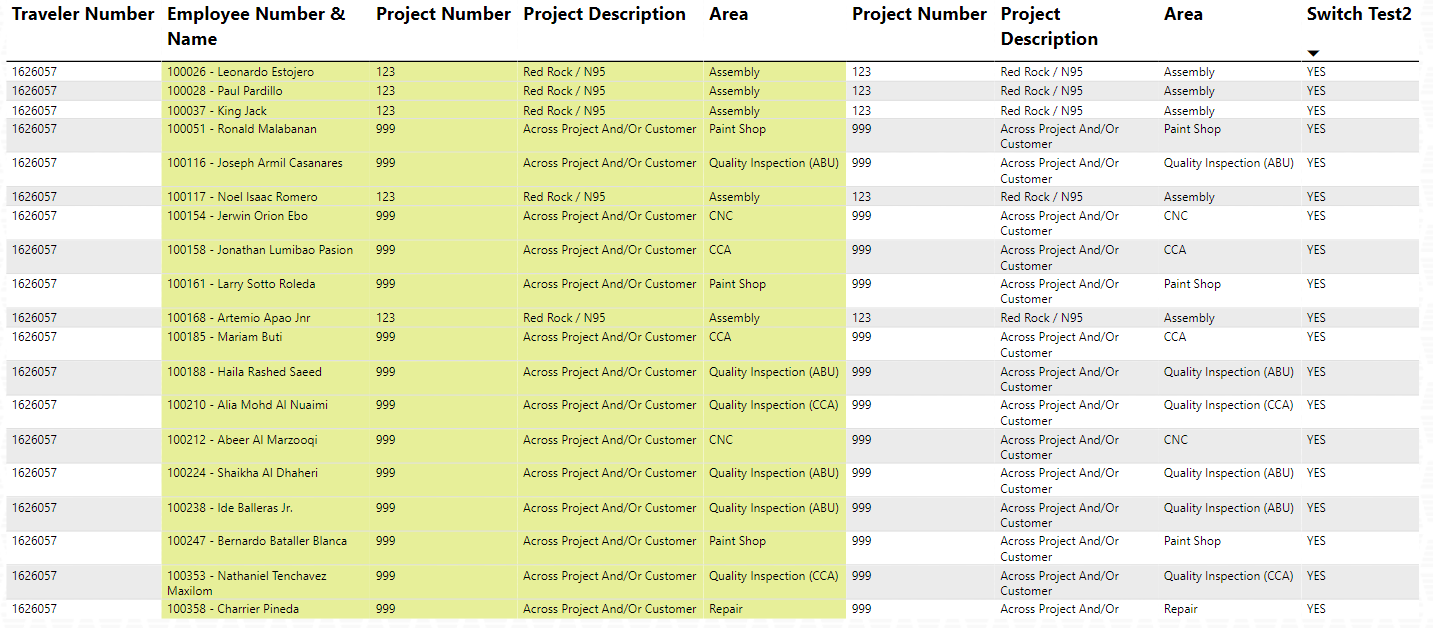
Just now I got the time to go through your new file as well as old file which you provided to me in the previous post. And compared both the formulas i.e. Mine formula with the formula provided by @BrianJ. And they both show absolutely correct results. Below are the screenshots provided for the reference -
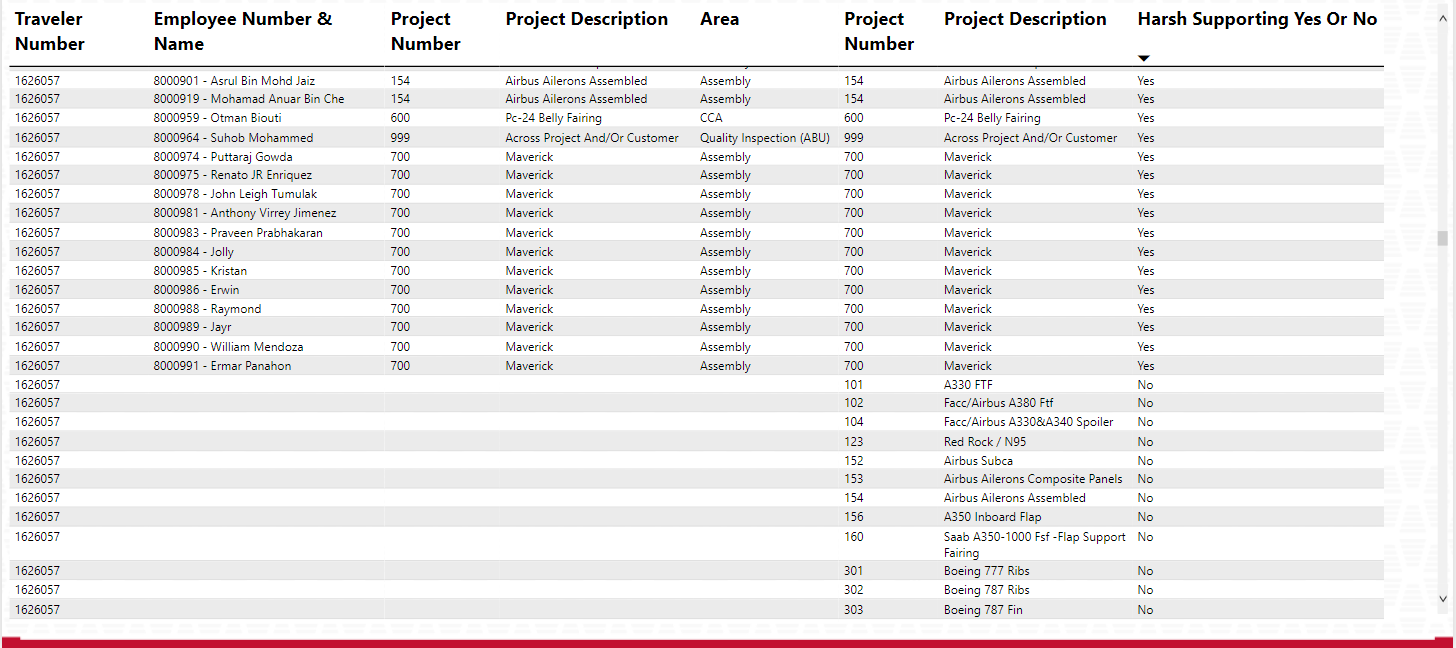
Now, this was the query that you had posted after using the formula which I had provided -
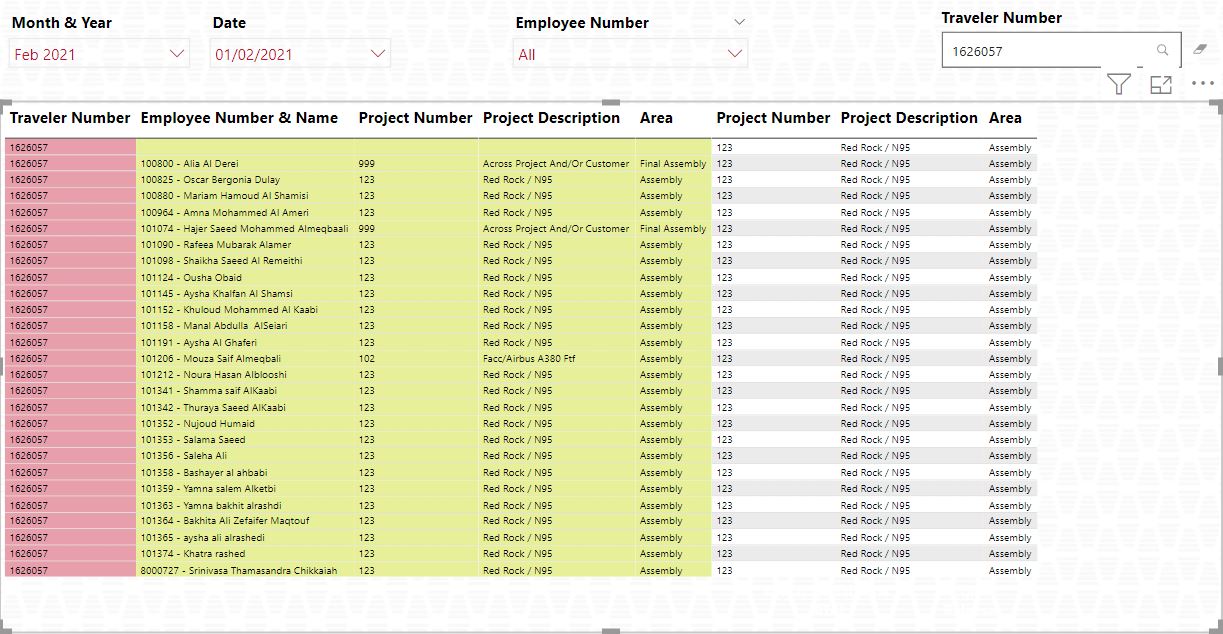
"I get a row for every date for ever staff member and also i get a project description entry for every type of project description in the materials & projects table.
The measure actually works theres yes and no in the right place just there something off with the context or relationships probably.
if you remove your measure from the table thats how i need it with the yes and no in place as shown here."
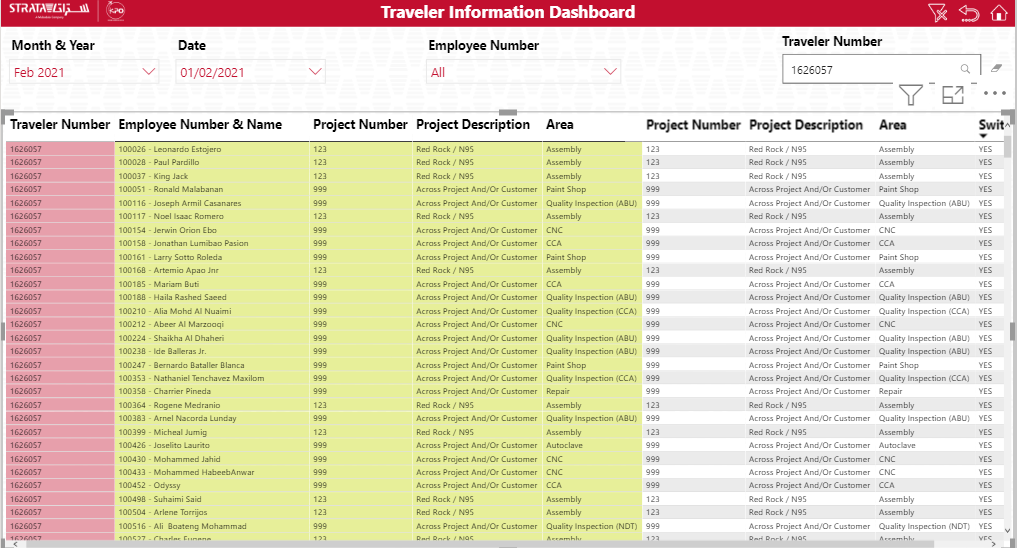
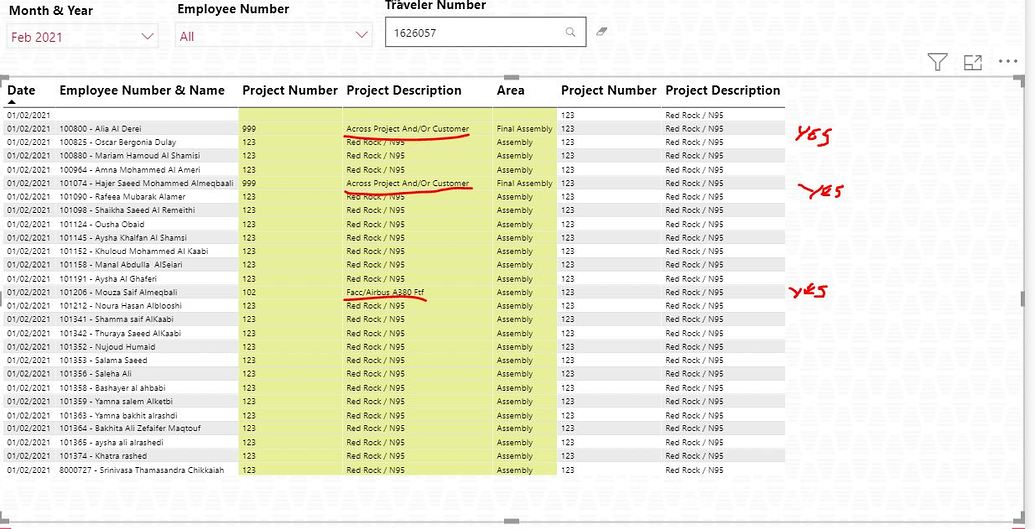
And to this I responded that “you were using all the fields from the dimension tables”. So now since you’ve used all the fields from the dimension tables itself it generates every record against each individual row since dimension tables cannot be connected with each other otherwise there’ll be a circular dependency error. When you use all the fields from the dimension tables it acts like “CROSS JOIN” concept. And therefore the result that you wanted to achieve which you’d highlighted was not possible. Below is the screenshot provided for the reference (The result that you wanted to achieve) -
Now, as I mentioned the reason about why you cannot achieve this desired result. Based on this very same concept @BrianJ had created a video which explains the logic behind this. When I stated the reason of problem into the model I expected you to create a “Unique Keys” and than join the model using those keys and than you’ll be able to achieve to result that you were looking for. But note that you’ll have to insert the “Unique Keys” into the visualization which binds the table and not the actual fields itself like which has been used right now otherwise result will remain the same.
Hoping that now everything is clear about where the problem actually was and also why you’re getting the multi-row results in both the files i.e. the file, one which I had provided in the previous post and the one which @BrianJ has provided in this post.
Lastly, also providing the link of the video which @BrianJ has created just few days back based on this very similar topic.
In your top 2 screen shots the data is not correct as they all say Yes which is not the case.
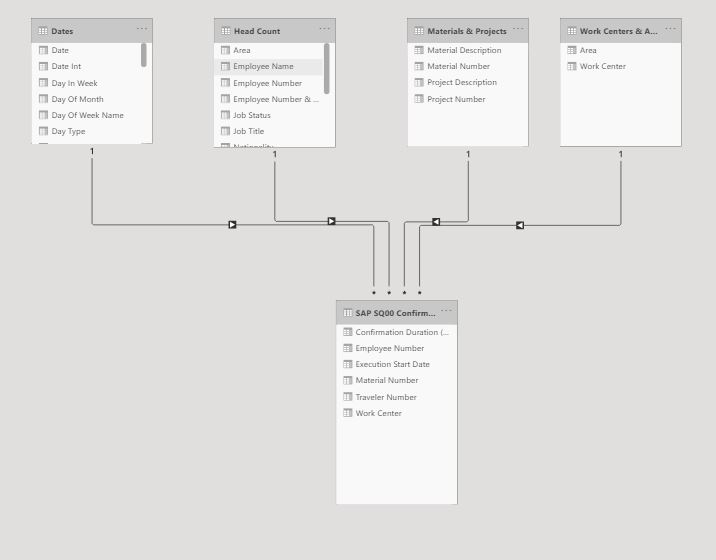
Unfortunately i still don’t understand what you mean or how i go about fixing this issue Its not possible for me to create unique keys that directly relate to the fields i need in dimension tables as the data simply isnt available in the SQ00 Fact table. The only 3 columns in the Fact table i can work from are
Head count, employee number to Employee number in fact table
Materials & Project, Material Number to Material number in the fact table
Work center & Area, Work center to Work center in the fact table.
I thought this was the whole reason of power BI in creating relationships to allow you to access data from dimension tables that wasnt directly related to the main fact table.
I really am not good at reading and understanding things, but if i see things and how they work i can learn better is it not possible you can adjust the PBIX and get it working so i can see what you are doing?
Really appreciate you taking time to reply to me and im sorry i dont understand you so well.
As you mentioned - “In your top 2 screen shots the data is not correct as they all say Yes which is not the case.” Absolutely, not true. Please scroll the screen downwards to see the entire results.
Hi @Krays23 , did the response provided by @Harsh help you solve your query? If not, how far did you get and what kind of help you need further? If yes, kindly mark as solution the answer that solved your query. Thanks!
I understand @Krays23, we strive to answer ALL inquiries in the forum. However, if you are sure that you provided all pertinent context to your concerns and read how to use the forum more effectively and still find your question unanswered, you can check out tutorials to learn this yourself as your membership also comes with relevant resources that may help you with your Power BI education.
While our users and experts do as much as reasonable to help you with your inquiries, not all concerns can be attended to especially if there are some learnings to be done.
Kindly mark as solution the answer that nearly solved your query. Thanks!
Hi @Krays23 , a response on this post has been tagged as “Solution”. If you have a follow question or concern related to this topic, please remove the Solution tag first by clicking the three dots beside Reply and then untick the check box.
We’ve recently launched the Enterprise DNA Forum User Experience Survey, please feel free to answer it and give your insights on how we can further improve the Support forum. Thanks!