Hello @agagnon,
Thank You for posting your query onto the Forum.
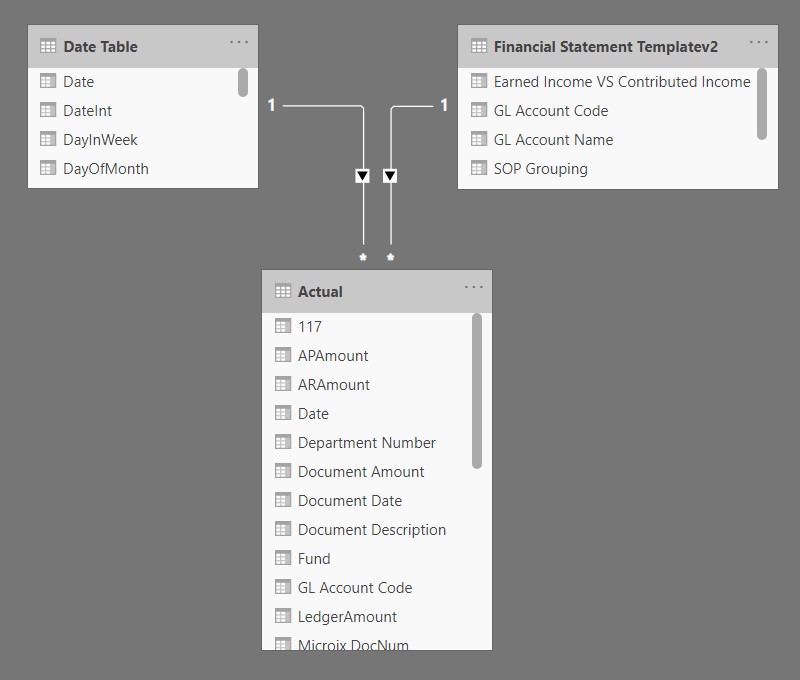
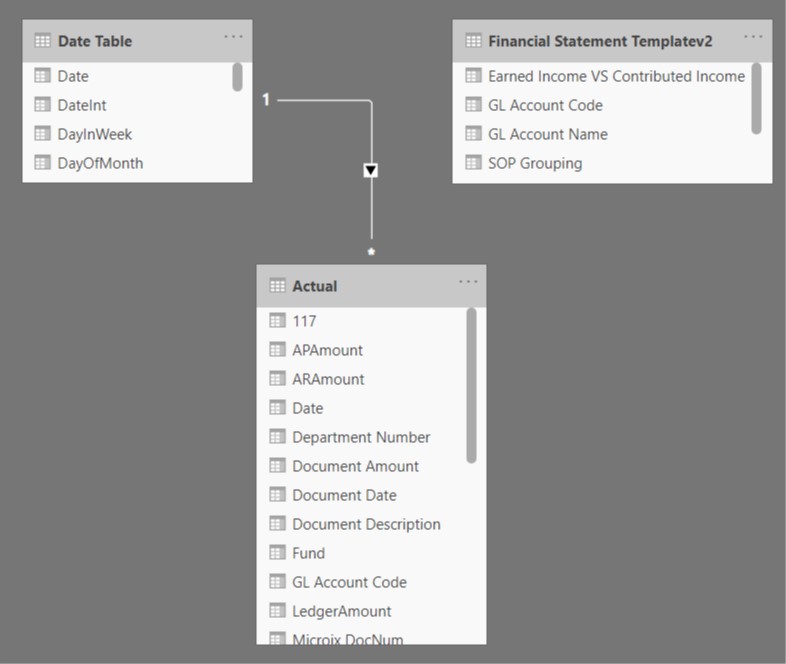
Well the problem was not with the "SWITCH( TRUE() )" function. It was actually due to the relationship that you’d created between between the models. Below is the screenshot provided for the reference -
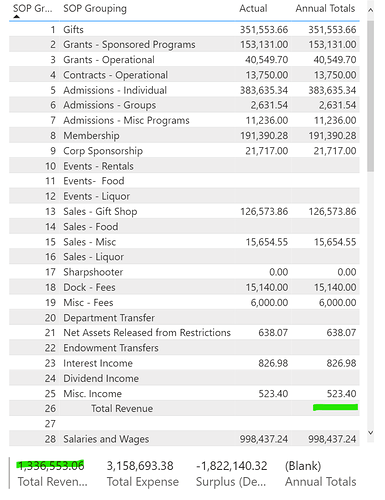
Now, let’s understand why the Sub - Totals were not getting reflected but the Total of each individual line items were being shown.
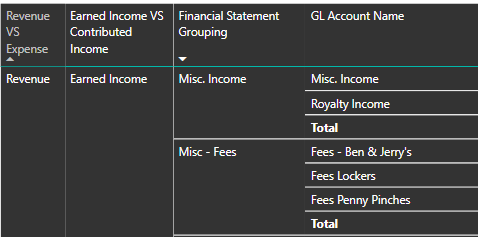
In the Financial Template Table, you’ve a column with the name “GL Account Code” and under that you’d the codes of the each individual line items as per the system generated. But then you’ve added your custom codes also defining the “Sub-Totals” category. That is you’ve assigned the GL Account Codes as as provided in the screenshot below in your Financial Template Table to the following line items -
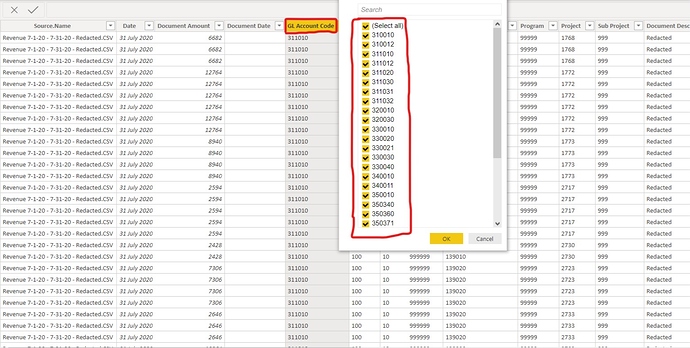
But when you refer you “Actual Table” you don’t have any such codes under the column "GL Account Code. Below is the screenshot provided for the reference -
So now when you’ve created “One-to-Many” relationships between your Template Data and Actual Data on the basis of “GL Account Code” it recognised only those codes which were available in both of these tables and therefore, it ignored the “GL Account Codes - 1, 2 and 3” and this is the reason why it showed you the blank under the sub-totals. Below is the screenshot provided for the reference -
And now, because of this I discarded the relationship between between the Template Data and the Actual Data. Below is the screenshot provided for the reference -
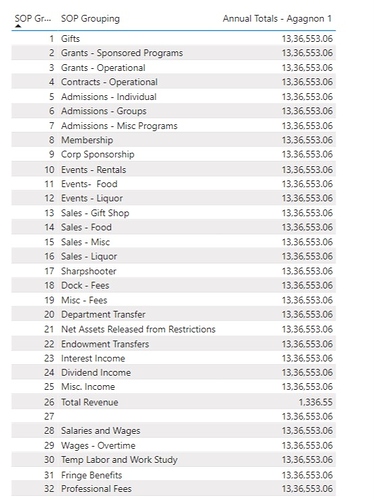
Now, since I’ve discarded the relationship your formula alongwith the visual will also collapse due to the wrong referencing made with the table. In the given screenshot, you’ll observe that you’ve referenced the Template table whereas it should’ve been Actual Table -
So the formula referencing itself is wrong since the beginning of your analysis. In this case, it means to say that under the Template table, Normalized Items should be equal to the Normalized Items of that table itself. And now, also due to no relationship between the Template and the Actual Table, the visualization will show the undesired result -
So now the correct formula will be as provided in the screenshot below -
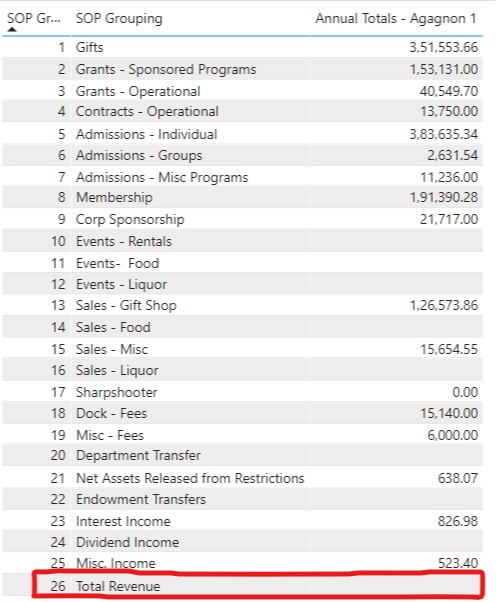
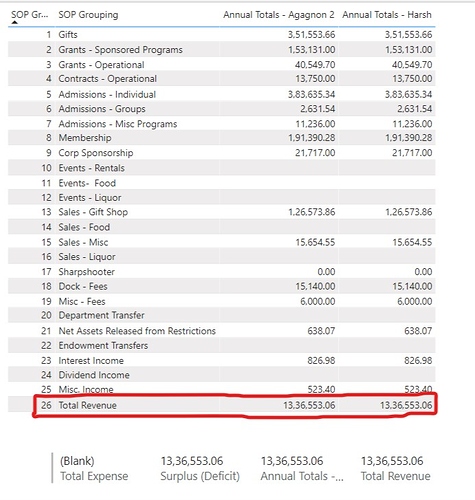
And now, the visualization will show the correct “Sub-Totals” as provided in the screenshot below -
I’m also attaching the working of PBIX file for the reference.
Hoping you find this useful and meets your requirements that you’ve been looking for. 
Please Note: To calculate the “Annual Total - Harsh”, I’ve followed the @sam.mckay’s method. Please refer the file to understand how that’s been done.
Thanks and Warm Regards,
Harsh
Finance Model V1.pbix (203.9 KB)
![]()
![]()
