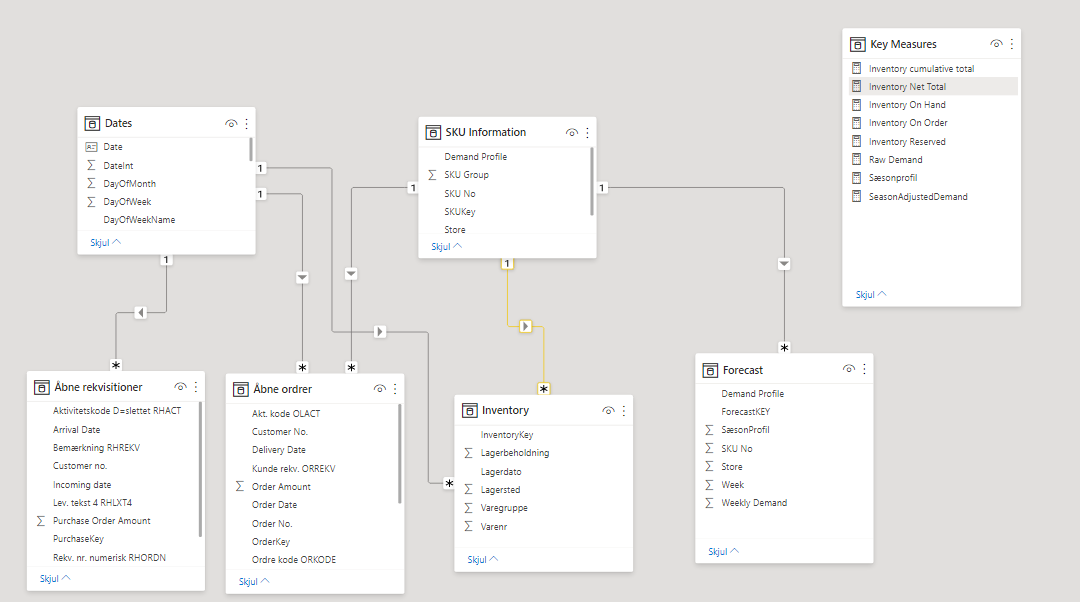
I am able to connect the Åbne rekvisitoner (Purchases) table, Åbne ordrer (Orders) table and the Inventory table with the Dates Table. However the forecast data is only available on a weekly basis. I have tried connecting it via week number to the dates table, but that creates a many to many relationship error.
I must admit i am kinda at a loss as to how i solve this issue. Do anyone have any pointers to how i can connect my forecast fact table with my dates table, such that i can link all tables together and calculate the available to promise amount?
I have uploaded a simplified version of my data and the powerbi file, that doesent contain any sensitive information.
First off, great job – for someone relatively new to Power BI and data modeling, you put together a really nice star schema compliant data model that should be very well suited to your analysis. Also, thanks for providing all the relevant information and files – makes providing good support much easier.
OK, on to your problem. This is an absolutely textbook granularity mismatch problem, frequently seen in budget contexts comparing actual to budgeted amounts, and also in cases similar to yours comparing actuals to forecasts.
What you need to do is to allocate your weekly forecasts down to the daily level, such that your Dates table, your inventory and forecasts are all operating on a daily granularity. There are two different strategies you can use to do this – the first is to do it via DAX and then build the necessary relationship in your data model virtually using TREATAS. The second approach is to do the allocation in Power Query and then connect your tables using a physical relationship, the same way you have for all other relationships within your data model.
Please refer to the granularity section of the following post, where I provide links on exactly how to implement both methods. Both methods are entirely valid and the choice will be one largely of personal preference. Personally, I prefer the Power Query approach , which I think is simpler and more intuitive.
I hope this is helpful. If you have any problems in implementation, just give a shout.
I have read your suggestions and the post that you linked to plus the video about ultimate budget allocation.
First I really like the idea of solving the issue in PowerQuery as i am more familar with this. However, in the problem of the week #4 challenge i see that a date is available in order to do the transformation to daily granuality. In my case i only have the week number and i wonder how i would go about it then. Do i need to force the dates into the forecast table and thus get 365 rows for each SKU?
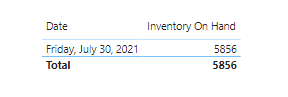
Second. I have tried to use the TREATAS function and it seems promising. Now the issue is that my Inventory on Hand data dont show correctly. Inventory on hand comes from my inventory table in form of the measure: Inventory On Hand = SUM( ‘Inventory’[Lagerbeholdning] )
However the inventory table is connected to the dates table by a date column that only shows the 30/07/2021 because that is the day i extracted the inventory status from the system. Could this be the issue?
I have reuploaded my powerbi model with the new ForecastAllocation measure based on the ultimate budget allocation module. In case that helps.
Yes, in terms of the Power Query approach, make sure to use the most recent version of the Extended Date Table code. This includes a field called WeekEnding. Merge the date table and the forecast table on week number and then bring this WeekEnding field into your forecast table. You can then use the List.Dates function on the WeekEnding field to create a daily granularity.
In terms of DAX, yes the fact that your inventory table date field contains only one date will mean that your measure will aggregate all your inventory into that date. This is a problem you will need to address regardless of which approach you take, since once you develop a daily granularity in your forecast table, you will have the same problem in terms of only showing actuals on July 30.
Hi @FrederikForum, did the response provided by @BrianJ help you solve your query? If not, how far did you get and what kind of help you need further? If yes, kindly mark as solution the answer that solved your query. Thanks!
All right. Thank you very much for your help Brian. This has helped me a lot regarding the understanding of granuality and the importance for the relationships in the the data model.
I will look into using WeekEnding date and implement it into my Forecast Table and then i’ll have to see what can be done with the Inventory Table.
Great – glad that was helpful. I think if you can capture the date the inventory on hand was taken for each inventory figure in your inventory table, using the above process should result in a final model that will make your DAX extremely simple.
If you have any problems in the actual implementation, just give a shout.