I’ve spent a couple of days trying to figure this out, but alas it’s beyond me.
The functionality I need to be able to crete is sort of presented here:
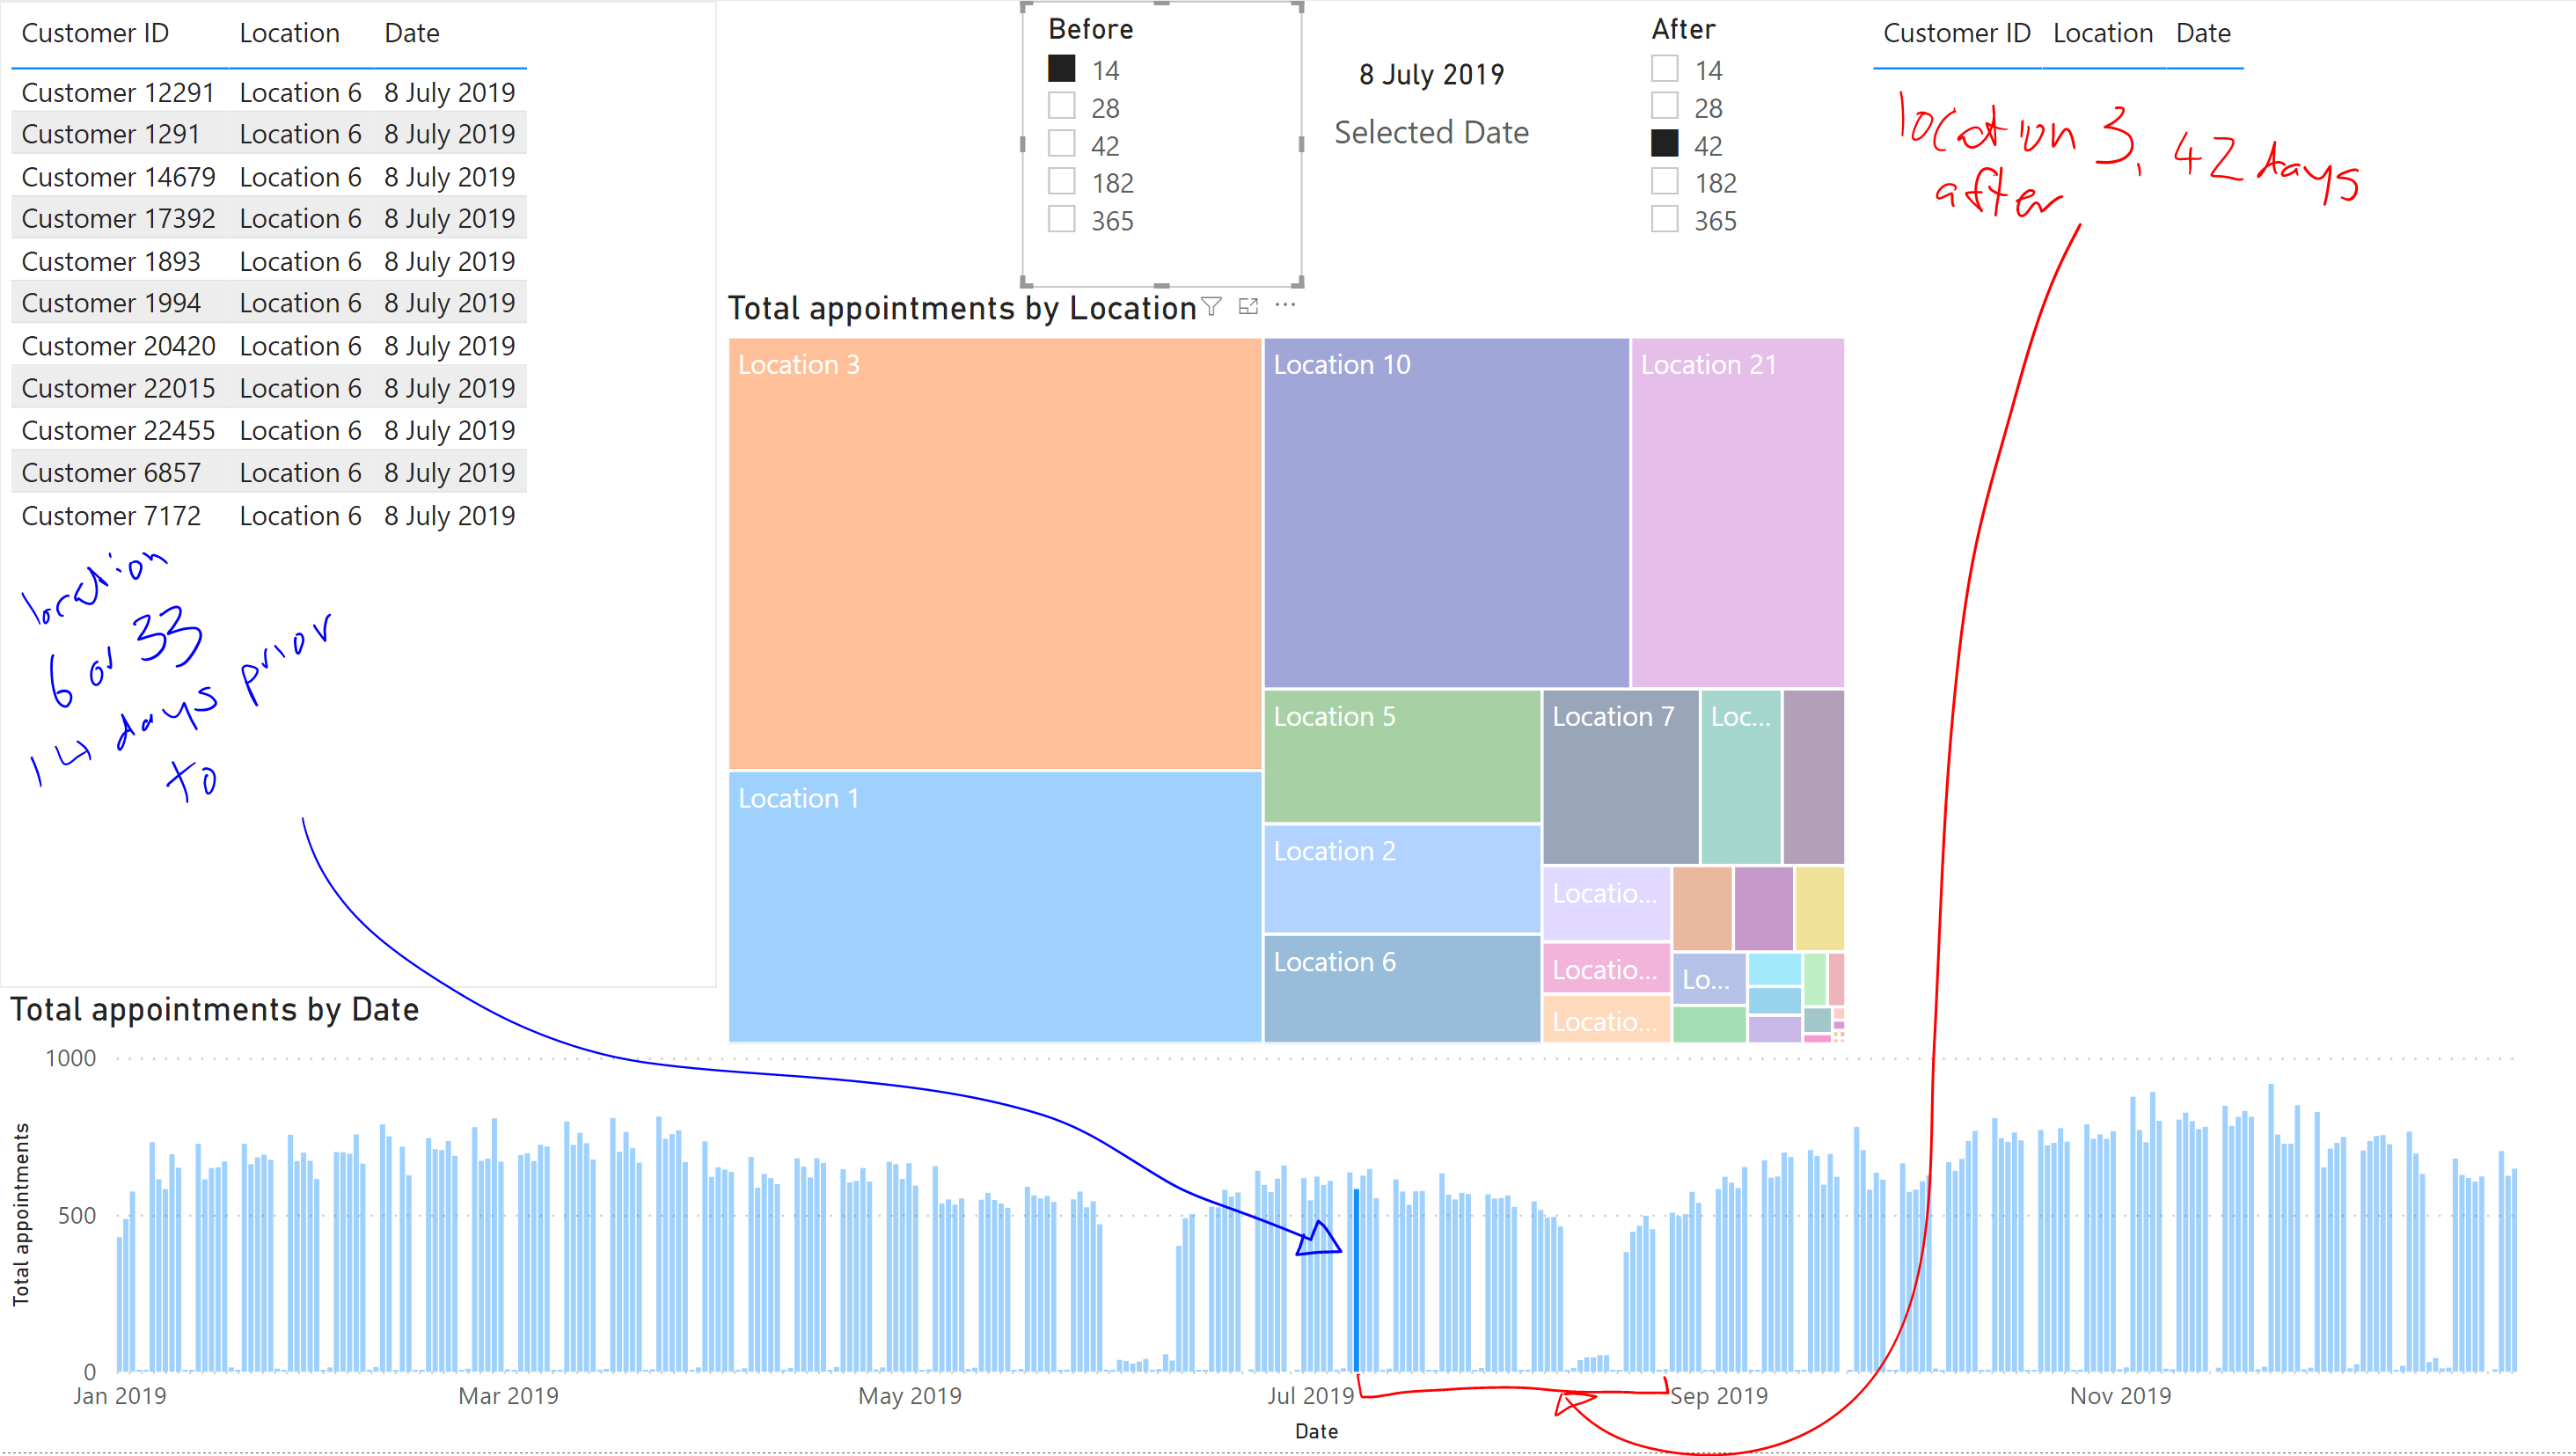
The user selects a date from the timeline, then chooses a date range before (14 days in this case), and date range after (42 days).
I have to show the customers in the right side table who had an appointment in category 1 or 2 (shown as an aggregation in the Manhattan at the bottom, and details the table on the left) in Locations 6 or 33 (left table) who then went on to have a subsequent appointment of Category 1 or 2 in Location 3 in the date range selected (42 days after 8 July 2019).
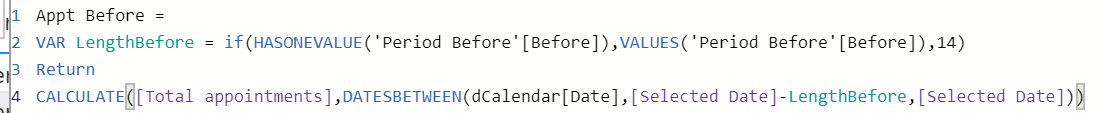
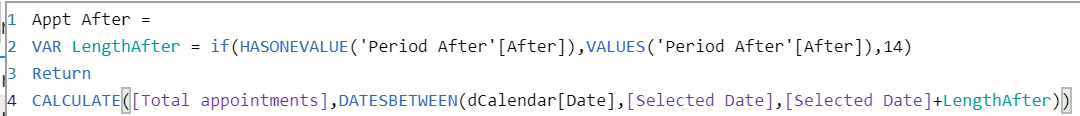
I have written DAX to slice the tables before and after the selected date, by the selected date ranges, but can’t figure out how to present the result as the intersection of these tables, and I’m sure I’m missing something simple/obvious here.
Or maybe not.
I really want to do this in DAX so I can later make this easier to repeat this for different locations in the left and right tables (“Before” and “After”) instead of pushing this to Power Query which would mean re-writing every time a different department has an idea for another analysis.
I’ve removed these measures I wrote to present the tables except for the aggregation from the .pbix to simplify things, but can put them back in OK. (The table on the left now just has a filter applied to the visual).
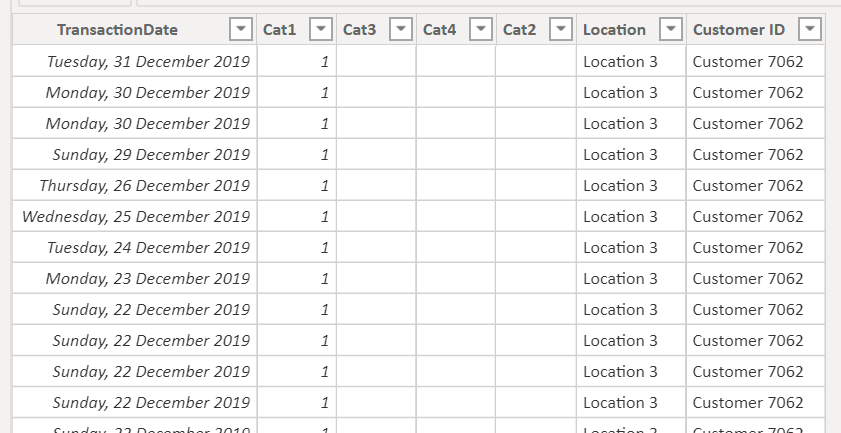
The .pbix is real data, greatly simplified and anonyised.
Appointments (transactions) have been collapsed to 1/null for the 4 different categories.
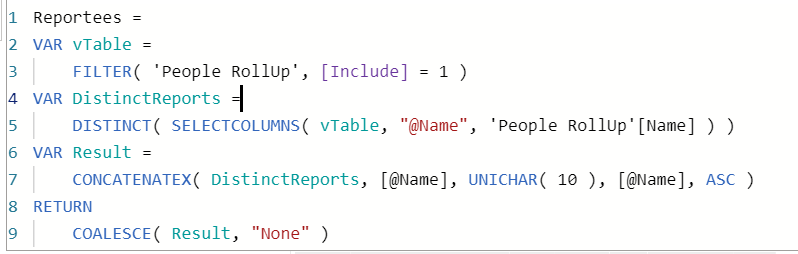
I wrote some DAX recently for a different solution that I think you’ll be able to easily adapt to get to your desired end result. I’m assuming your two virtual table measures are returning the correct records. If so, you can use similar code to the DistinctReports variable to pull a single column table of customers out of each virtual table. Let’s call these tables vCustomers1 and vCustomers2
The intersection of customers who meet both criteria will be a virtual table defined by
VAR vCustIntersect = INTERSECT( vCustomers1, vCustomers2 )
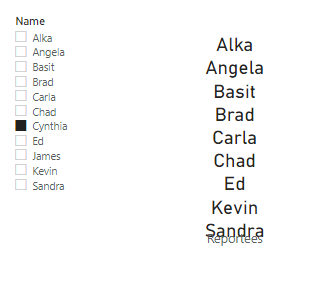
You can now pop that vCustIntersect table into a result variable structured per below using CONCATENATEX and UNICHAR(10) to return the names in the table as a scalar that looks like a column of names.
Thanks for your help, I really appreciate it.
I think I’m getting closer in the attached, but need to clear a couple of things up.
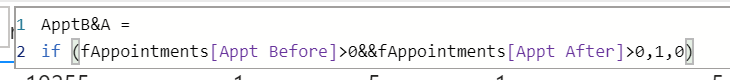
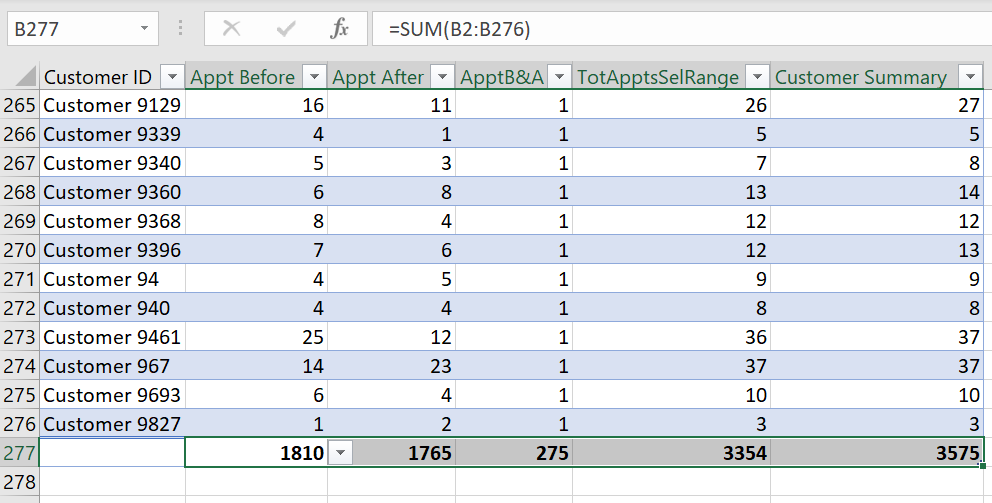
I’ve made a measure to flag when individual customers have appointments in the “Before” and “After” range so I can then filter that table when this is >0
For usability, I turned off the cross filtering between the Manhattan and the other visuals which is now acting as my date picker.
How do I filter my table so that only those customers with appointments in the date range (the dates between the lower and upper limit specified). I thought adding the filter to the visual where ApptB&A was >0 would work, but I’m misunderstanding something here.
Thanks again for any help. DAX Intersection problem.pbix (653.6 KB) Current .pbix attached.
Hi @rodwhiteley! We noticed that your inquiry was left unsolved for quite some time now. We strive to answer ALL inquiries in the forum. However, if you are sure that you provided all pertinent context to your concerns and read how to use the forum more effectively and still find your question unanswered, you can check out tutorials to learn this yourself as your membership also comes with relevant resources that may help you with your Power BI education.
While our users and experts do as much as reasonable to help you with your inquiries, not all concerns can be attended to especially if there are some learnings to be done. Thank you!
Thanks for chasing up on this - as you say I’ve checked a lot of resources, but remain stuck. The previous reply shows where I got to along with the .pbix.
If there’s any help available I’d greatly appreciate it, especially if you can point me in the right direction for some more learning resources that can fill in the gaps in my knowledge.
Yup, you’ve definitely put in the hard work and thought on this one and provided your work in progress, which is exactly what we ask and makes me feel doubly bad about dropping the ball on this one.
Hopefully, I can get you what you need, which also may work great for me since I’ve been looking for a good example to use in a video I’ve got in progress on debugging virtual tables. Will make this a priority today, along with another one that I owe @Matty.
Been working on this for a while – I believe I’m very close to a solution, but getting one result I don’t quite understand yet. Will check/debug on Saturday, and should have a solution to you then.
You were definitely on the right track. A few small things first:
be sure to mark your dCalendar table as a Date Table. This is critical for getting rid of the temporary date tables and ensuring that all time intelligence functions work properly.
be sure to adhere to standard DAX notation: measures should NOT have a table name associated with them, columns SHOULD have an associated table name, and virtually created columns should begin with an “@” sign.
The main problem with the approach you took was that it double counted the selected date. Using DATESBETWEEN, the calculation is inclusive of the endpointdates you specify. So, both your Before and After measures included the selected date, double counting it and throwing your totals off. The way I handled this was to create three measures - before, on and after. I think that’s the clearest way to handle this, but you could also include the selected date in either before or after, by using <= rather than just < (or conversely >= vs >).
As I’ve mentioned in other threads recently, I generally don’t like or use the canned Time Intelligence functions, perferring to “roll my own”, which I feel gives me a much better sense of what’s actually happening within my measures, since all of my calculations and assumptions are explicit, not buried within the documentation of a particular TI function. Thus, I rewrote all the time based measures to a form like this:
Total Appt Before =
VAR LengthBefore = [Harvest Days Before]
VAR SelDate = [Selected Date]
VAR Result =
    CALCULATE(
        [Total appointments],
        FILTER(
            ALL( 'dCalendar' ),
            'dCalendar'[Date] < SelDate
                && 'dCalendar'[Date] >= SelDate - LengthBefore
        )
    )
RETURN
    Result
Finally, while technically there’s nothing wrong with selecting a date from the bar chart at the bottom of the page, it’s not a good user experience - hard to pinpoint a particular date, hard to clear. I used a dropdown slicer instead, which is marginally better but still not great. If I were doing this in a client report, I would use a single value date slider, constructed from the After slicer. I just talked about this technique in my most recent video yesterday:
I hope this is all helpful. Full solution file attached.
Hi @rodwhiteley , did the response provided by @BrianJ help you solve your query? If not, how far did you get and what kind of help you need further? If yes, kindly mark as solution the answer that solved your query. Thanks!
Indeed it did, and it’s a thing of beauty.
My apologies for not marking this as solved before now, but I was just filling out the required forms so @BrianJ could take a pat on the back out of petty cash for doing all this - I just love this community. Thanks again,
Rod