HR People RollUp - How to search across columns?

I’ve spent to many hours on this ask so before I give up I’ll try the forum for help.

Our HR rollup data is terrible. It’s not properly aligned, teams always have to manipulate an excel file.

I’ve attached an example of the file output. The issue is that the columns don’t give a proper alignment for managers. As well the column header names really don’t mean anything either.

I don’t know how to edit the data in PowerQ or write a DAX that would allow me to Type in Cynthia and get all the people who report into her. These people roll across different columns.
EDNA - People RollUp.xlsx (16.8 KB) EDNA - People RollUp.pbix (102.7 KB)

3 Likes

Chad,

I love these types of problems. Clarifying question: in your desired scenario, if one typed in Cynthia what should the result be? Everyone other than James (i.e., direct and indirect reports), or just Ed, Sandra and Carla (direct reports)?

BTW - thanks for providing the PBIX and the XLSX - definitely makes providing support easier.

  • Brian
2 Likes

@chad.sharpe,

Super interesting problem. I can see why this gave you trouble - definitely not an easy one to crack.

Here’s the general approach I took:
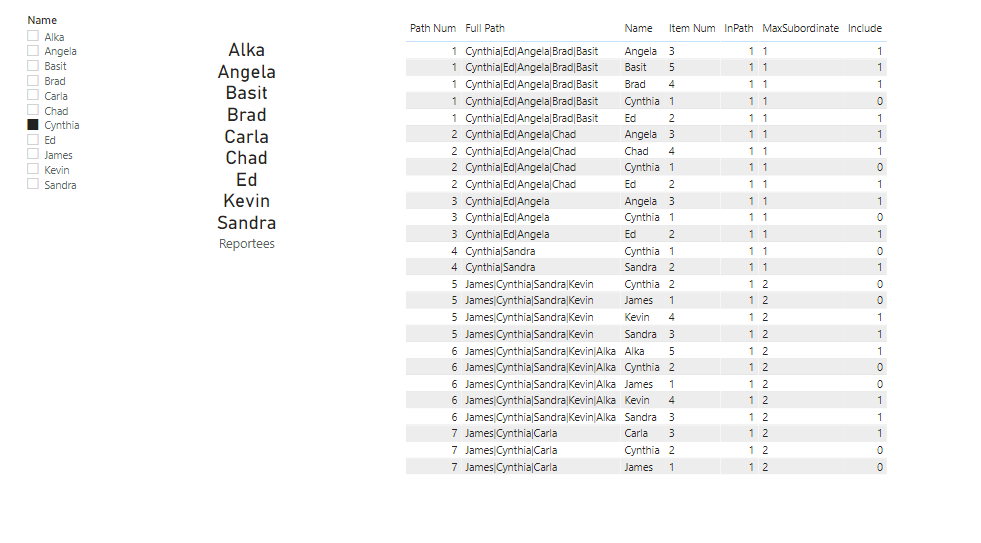
POWER QUERY

  • Added an index called Path Num to the source table
  • Created a Full Path Parent-Child Hierarchy by merging columns L8 through L4 with “|” as the delimiter, with some additional text processing to remove the extra delimiters around null columns
  • Unpivoted columns L8 through L4
  • Used GroupBy and Table.AddIndexColumn to assign an item number representing the position # in each path of every name in that path

DAX

Created a disconnected table slicer on employee name
Created a measure called InPath, which had a value of 1 if the selected employee from the disconnected slicer was in the full path, 0 otherwise
Created a measure called MaxSubordinate which calculated the Item Num for the slicer selected name within each path
Created a measure called Include which got assigned 1 if both of the following conditions were true, 0 otherwise:

[InPath] = 1 AND
SELECTEDVALUE( ‘People RollUp’[Item Num] ) > [MaxSubordinate]

Finally, created a measure called Reportees that like the rug in The Big Lebowski, tied the whole room together:

Reportees = 
VAR vTable =
    FILTER( 'People RollUp', [Include] = 1 )
VAR DistinctReports =
    DISTINCT( SELECTCOLUMNS( vTable, "@Name", 'People RollUp'[Name] ) )
VAR Result =
    CONCATENATEX( DistinctReports, [@Name], UNICHAR( 10 ), [@Name], ASC )
RETURN
    COALESCE( Result, "None" )

Here’s the whole thing in action:

I hope this is helpful. Full solution file posted below.

4 Likes

@chad.sharpe,

One additional thing - I think I’ve provided you a solid solution to your specific requirement above, but for other issues that may arise in working with this type of dataset, I would really recommend detailed study of the outstanding Parent-Child Hierarchy section of the 2nd Ed of DAX Patterns. This same material is also avaialble for free on the DAX Patterns website:

https://www.daxpatterns.com/parent-child-hierarchies/

I learned a lot going back through it in working on your solution. It’s not light reading, but if you are going to have to work with this dataset on a regular basis, I think you’ll find it well worth the effort.

  • Brian
3 Likes

the end goal would be everyone under Cynthia. As she is the VP, she would want to see all the people under her. Excluding James as I think you are eluding to here.

1 Like

@chad.sharpe,

Cool - I guessed correctly. I think the solution above should meet your requirements then. Please give it a go and let me know if it’s on the mark.

image

Thanks!

  • Brian
1 Like

wow… this is great, it’s exactly what I was trying to do.

I’ll have to take this away and try and recreate it myself, most of the solution have items and DAX I’ve never used before.

1 Like

dude… this is great… the extra effort of providing readings is icing on the cake/solution. I started reading it, to say it’s not light reading is an understatement. lol

2 Likes

:+1:. Glad that got you what you needed. Win-win here, since I had a ton of fun working through this one. Had to throw some of the less frequently used tools in the toolbox at it, so as you work through it, if you have any questions don’t hesitate to give a shout.

  • Brian
1 Like

I’ve run into a snag… I’ve attached my working file. The data cleaning and formatting works well. I like the merge across multiple rows for the visual rollup. I’ll be that in some other items as well.

Where i am stuck… you created a new table called “Disconn Emp”. I’m not sure how you created that? the image doesn’t look like a normal table?

I also realized that their might be a fundamental issue with my data. The data we get from HR is first, last name. We have 100K employees so there will be some people with the same first last names. However, I would still like to complete the task for the experience and to see how the end result looks.

Test Roll Up.pbix (11.6 MB)

1 Like

just a thought, does your data have employee number, if so you could include the employee number with the name so its exact.

1 Like

it does… :slight_smile: interesting…
I’ll have to give that some thought. When we do the search I’ll still run into the same issue i think unless the person doing the search knows the emp number. emp number is not something people know.

But… I’ll try it out.

1 Like

maybe job title ? use first and last name together

1 Like

@chad.sharpe,

In answer to your questions, Disconn Emp is created as a DAX Expression Table using VALUES(). It could just as easily be created in Power Query (and probably should be). I recently did a video explaining the three types of Power BI tables that I think you’ll find very helpful in understanding this solution.

For the second issue, I’m going to show you a trick that blew my mind when I saw it. You can actually distinguish between different items/people with the same name using invisible characters tacked onto the end of the column value. The SQLBi guys were the ones I first saw do this using DAX, and I’ve adapted this approach into Power Query using this basic pattern:

  1. Group in PQ on Full Name and add an All Rows aggregation called [Data]

  2. Add an index within each grouping with Custom Column:

=Table.AddIndexColumn([Data], “Index”, 1, 1)

  1. Add calculated column concatenating relevant field with (Index - 1) UNICHAR (8204) nonprinting character

Article link: https://www.sqlbi.com/articles/handling-customers-with-the-same-name-in-power-bi/

The final question to solve is how to distinguish between say, the three distinct employees named “Mike Jones” in the slicer. After you apply the invisible characters trick above, you will have three Mike Joneses in the slicer, but no idea which one is which. If you’re willing to use custom visuals, OK Viz has an awesome slicer enhancement called Smart Filter Pro that I use all the time. One of the enhancements that it has is that it can display a measure result next to the slicer choice. In this case you could use a LOOKUPVALUE measure to identify a distinguishing characteristic for each employee (e.g., job title, division, “Cooks Fish in the Common Microwave” Mike Jones vs “Never Refills the Printer” Mike Jones, etc.).

I hope that addresses all of your questions/concerns. If you run into any other problems, just give a shout.

– Brian

3 Likes

The video is great… but the icing on it was the that’s not a dog that’s a wolf… it’s nice to have a little laugh when PowerBi melts my brain…

2 Likes

Hey Brian,
I’ve been able to duplicate your solution against my larger dataset. I’ll be honest some of (most of the dax measures) are far past my skill set. I’ll have to go back and review some of them to get a better understanding.

The issue I have now is that I can’t add costing details to the reportees as it’s a virtual table. Or, most likely i just don’t know how. I’ve added a second tab to the attached excel. The end goal of this model is to show how much money each person is billing and have it so that the manager can filter on their name and see all the people below them (done), but also see the billings of each of those people.

EDNA - People RollUp.xlsx (19.0 KB)

1 Like

@chad.sharpe,

We can take excellent advantage of the hard ground we plowed in the last version, by reusing much of the same code in the Reportees measure. The first measure below checks whether each name in the rollup table is a reportee to the name selected in the disconnected slicer. If yes, it assigns a 1, if no a 0. We can then use this 0/1 measure in the filter pane to filter the table visual down to only the relevant reporting staff.

The second measure steps through these reporting staff, and does a lookup for the 2020 billing amount in the Cost table.

Display Name = 

VAR vTable =
    FILTER( 'People RollUp', [Include] = 1 )
VAR DistinctReports =
    DISTINCT( SELECTCOLUMNS( vTable, "@Name", 'People RollUp'[Name] ) )
VAR Result =
    IF( SELECTEDVALUE( 'People RollUp'[Name] ) IN DistinctReports, 1, 0 )
RETURN
    Result

Look Up Costs = 

VAR SelName =
    SELECTEDVALUE( 'People RollUp'[Name] )
VAR SelYr = 2020
VAR Result =
    CALCULATE(
        MAX( Costs[Billings] ),
        FILTER( ALL( Costs ), Costs[User] = SelName && Costs[Year] = SelYr )
    )
RETURN
    Result

Here’s what it looks like all put together:

image

Note that your billing table was not complete, so some names are missing from the results table.

I hope this is helpful. Full solution file attached below.

– Brian

eDNA Forum - People RollUp Solution With Billing22.pbix (120.2 KB)

1 Like