Question:
How would you format say the Margin % column only if for example it had negative % values so that the negative % values are red and the positive values are green?
what you are looking for here, is a conditional format - if you do a search on the forum, you will find several responses covering this topic for a variety of needs.
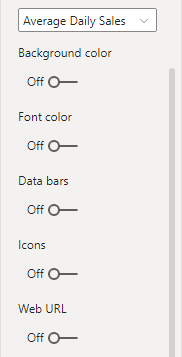
Conditional format settings for a table or chart can be found in the visual format settings (image below is from the column table settings):
Thanks @Heather. I have already done a search but couldn’t find anything helpful specifically for this problem. If you know of specific post please may you share the link.