Income statement template on a matrix

Hi,

Will the income statement template work on a matrix?

I found the video using tables but does a video exist creating an income statement using a matrix. Stakeholders like the drill up and down.

Thanks in advance.
Elizabeth

*** READ FIRST ***

Before you send your question.
Make sure that all details relevant to your question is complete:

  • Your current work-in-progress PBIX file - VERY IMPORTANT
  • A clear explanation of the problem you are experiencing
  • A mockup of the results you want to achieve
  • Your underlying data file

Check out this thread on Tools and Techniques for Providing PBIX Files with Your Forum Questions

Also make sure that your data file contains no confidential information. If it does, click the link above.

*** DELETE THIS MESSAGE IF YOU ARE SURE ALL YOUR DETAILS ARE COMPLETE OR IF THE ABOVE INFORMATION IS NOT APPLICABLE TO YOUR QUESTION.***

Hello @ElizabethTachjian,

Thank You for posting your query onto the Forum.

In case, you’re referring to the videos of Financial Reporting course from Enterprise DNA education portal then yes, those same techniques can be implemented into the Matrix visual as well i.e., drill up and down. Below is the screenshot of the results provided -

I’m also attaching the working of my own practice file on Financial Reporting for the reference purposes.

Hoping you find this useful and meets your requirements that you’ve been looking for.

Note: In this case, drill up and down is implemented over the “Columns” section and not over “Rows”.

Thanks and Warm Regards,
Harsh

Financial Reporting - Harsh.pbix (756.0 KB)

3 Likes

Hi Harsh,

Amazing work. I am not clear how the income statement template is linked to the model without a relationship and the filter context is still working. Are you able to explain please.

Also how did you get the drill on row and column option. I can see there is only the matrix visual on the page.

Lastly, can you direct me to an advance course only on the matrix visual or tricks related to a matrix please.

Thanks in advance.
Elizabeth

Hello @ElizabethTachjian,

Below are the answers provided to the following questions -

1). The Income Statement template is a disconnected table inside the data model. All the calculations are done w.r.t. the Fact and Dimension tables and then results are showcased/brought inside the template visual. For detailed understanding pertaining to the context, I would sincerely recommend you to go through the course on “Financial Reporting” which is available onto our Enterprise DNA education portal.

2). In order to set-up a drill-up and down functionality inside a Matrix visual, just keep on adding the fields under the relevant section i.e., either under Rows or Columns section. Below is the screenshot provided for the reference -

Fields Placed In Required Sections

Once you place them in a desired order, then select the option from a drop-down menu whether you want to implement a drill-up and down either over Rows or Columns.

In case, if there’s only one field placed under a row section and two fields are placed under a column section then by default drilling will be performed over the columns section and vice-versa.

3). Lastly, as far as I know of, there might not be a dedicated course available only on the Matrix visual but there’re so many short videos available over the Internet around that topic. Most of the techniques or tricks from the table visual are applicable in the case of Matrix visual as well but sometimes there might be a case where a certain technique may not applicable. For example, in a matrix visual conditional formatting is not applicable for Row Headers (atleast as of today).

Thanks and Warm Regards,
Harsh

Hi @ElizabethTachjian ,

The trick is in the measure branching (creating one measure with usage of another)

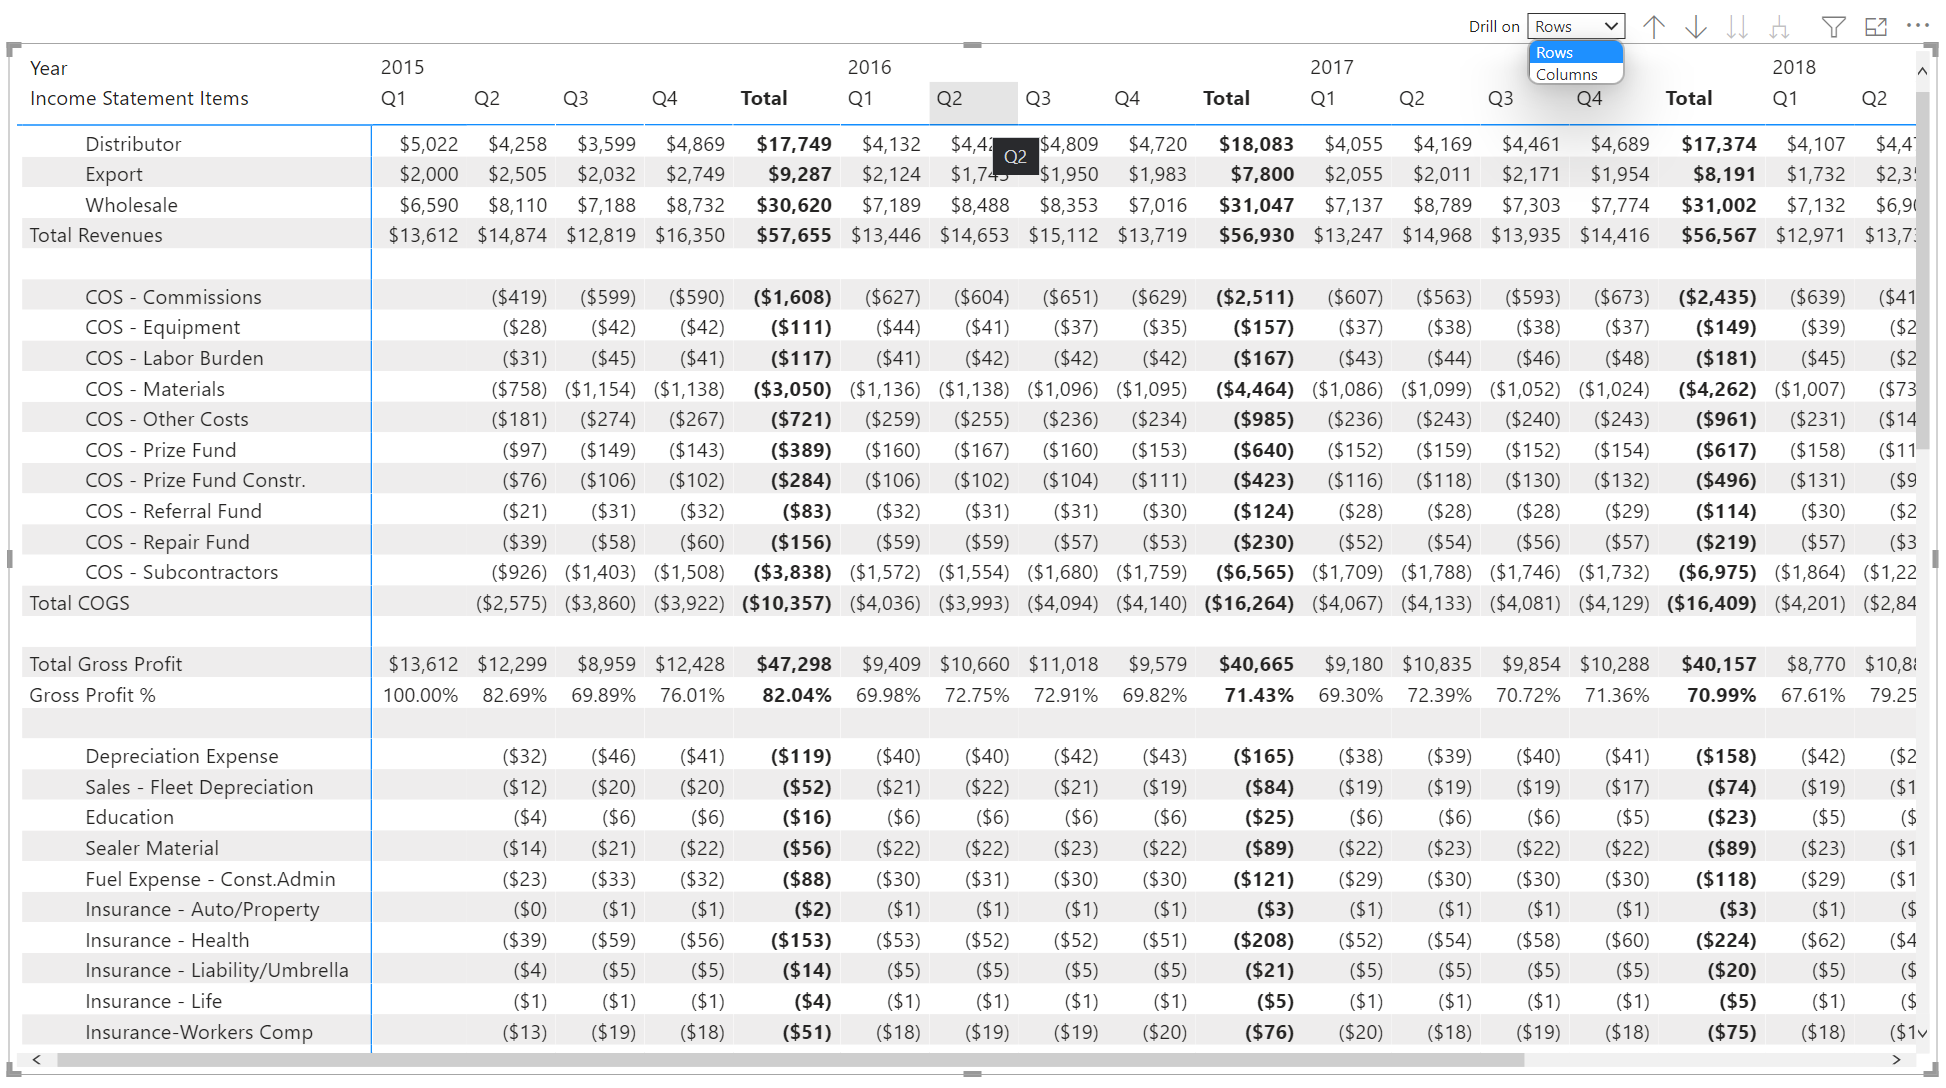
Do in matrix you have Selected Year Actuals :

Selected Year Actuals = 
VAR CurrentItem = SELECTEDVALUE( 'Income Statement Template'[Items (Normalized)] )

VAR _Results = 
SWITCH( TRUE() , 
    CurrentItem = "Total Revenues" , DIVIDE( [Revenues] , 1000 , 0 ) ,
    CurrentItem = "Total COGS" , DIVIDE( [COGS] , 1000 , 0 ) ,
    CurrentItem = "Total Gross Profit" , DIVIDE( [Gross Profit] , 1000 , 0 ) , 
    CurrentItem = "Gross Profit %" , FORMAT( [% Gross Profit Margin] , "0.00%" ) , 
    CurrentItem = "Total Other Expenses" , DIVIDE( [Other Expenses] , 1000 , 0 ) ,
    CurrentItem = "Total Net Profit" , DIVIDE( [Net Profit] , 1000 , 0 ) , 
    CurrentItem = "Net Profit %" , FORMAT( [% Net Profit Margin] , "0.00%" ) , 
        CALCULATE([Actuals (,000)] , FILTER( 'Income Statement Data' , 'Income Statement Data'[Items] = CurrentItem ) ) )

RETURN
IF( ISBLANK( _Results ) , 
    BLANK() , 
    _Results )

Which uses measures:

Revenues = CALCULATE( [Income Values] , 'Income Statement Data'[Type] = "Revenues" )
COGS = CALCULATE( [Income Values] , 'Income Statement Data'[Category] = "COGS" ) * -1
Gross Profit = [Revenues] + [COGS]
% Gross Profit Margin = DIVIDE( [Gross Profit] , [Revenues] , 0 )
Other Expenses = ( CALCULATE( [Income Values] , 'Income Statement Data'[Type] = "Expenses" ) + [COGS] ) * -1
Net Profit = [Revenues] + [COGS] + [Other Expenses]
% Net Profit Margin = DIVIDE( [Net Profit] , [Revenues] , 0 )

Actuals (,000) = 
VAR Revenue = CALCULATE( [Income Values] , 'Income Statement Data'[Type] = "Revenues" )
VAR Expense = CALCULATE( [Income Values] , 'Income Statement Data'[Type] = "Expenses" ) * -1

RETURN
DIVIDE(
IF( SELECTEDVALUE( 'Income Statement Data'[Type] ) = "Revenues" , Revenue , 
    IF( SELECTEDVALUE( 'Income Statement Data'[Type] ) = "Expenses" , Expense , 
        Revenue + Expense ) ) , 1000 , 0 )

And they are on the top of

Income Values = SUM( 'Income Statement Data'[Value] )

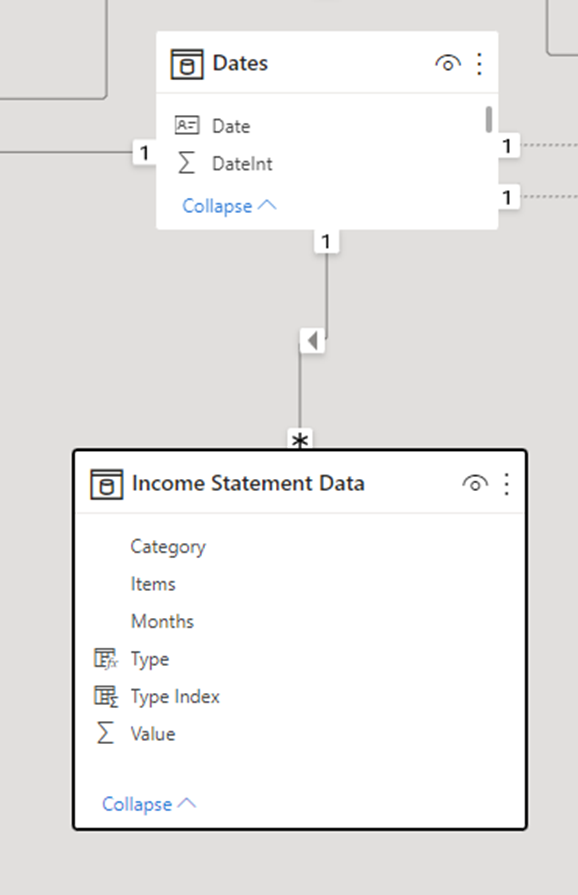
Which is in Income Statement Data table which has join to Date

Regarding matrix visuals - to get some ideas maybe my forum post about matrix suggestions can help for start:

1 Like

Hi,

Will a slicer still work?
I have not used field parameters but will give it a go today.
I cant wait to try this whole technique today.
Thank you for your guidance.

1 Like

Hi,

How you can explore filtering field parameters at my last challenge:

I used other visuals instead of slicers for filtering.

Enjoy exploring field parameters feature.

1 Like

Good Idea using other visuals instead of slicers for filterings.

1 Like

Hi,
Have you found a workaround for the below problem when a matrix and field parameters are used together.
Problem i Matrix keeps expanding all rows when I add a Parameter value

Hi @ElizabethTachjian

In some occasions it happens.

In some not - for example based on pbix that Harsh provide:

I notice when I create new measure with context change and add to matrix that might happened. I simple create new matrix.

If problem persist, arise a new post with more details specifical to that situation.

Regarding matrix visual, maybe you find following link useful:

Good luck.

1 Like

Thank you for sharing your knowledge

1 Like

Hi @ElizabethTachjian ,

I’m glad that I can help. I enjoy learning, exchanging and sharing knowledge…

Did you know that at next Enteprise DNA Summit - will be the topic dedicated to Profit & Loss statements (Day 1) - you can check agenda and find more details at:

1 Like

Great. Is the recording and resources going to be available immediately after the day one. I dont think I can stay up to 1am.

Question. Is there particular reason you have used the fact table and not the Dim table for the individuals totals. example
Actuals (,000) =
VAR Revenue = CALCULATE( [Financial Values], ‘Income Statement’[Type] = “Revenues” )
VAR Expense = CALCULATE( [Financial Values], ‘Income Statement’[Type] = “Expenses” ) * -1
RETURN
DIVIDE(
IF( SELECTEDVALUE( ‘Income Statement’[Type] ) = “Revenue” ,
Revenue,
IF( SELECTEDVALUE( ‘Income Statement’[Type] ) = “Expenses” ,
Expense,
Revenue + Expense ) ), 1000, 0 )
and used the fact table in here too

Regarding Summit: In the e-mail they mentioned: Replays as they become available - Industries Analytics & Application Summit

The link is going to Dashboard. I believe you need to go additionally to → Virtual Events → Summits to see reply’s after that.

Yes, some time zones are hard to follow. I am still calculating will be awake in 2 am or not for Python course. Benefit for live events is you can asks questions and exchange experience.

Regarding pbix file and measures that you mentioned this is from Sam’s course
Financial Reporting w/ Power BI course

I didn’t took that course, but knowing other Sam’s courses it’s fulfil with with step by step explanations and lots of practical ideas. Besides income statement, there are other financial statements covered as well.

Good luck.

Hi @ElizabethTachjian ,

Just post the link for summit recording:
https://app.enterprisedna.co/app/virtual-events/243/

Hope you will enjoy the sessions.

How do I get the matrix row subtotal to display for Level one and Level 2?

The data exist for Level 3 as per below but still no matrix row subtotal when row subtotal is turned on.

A matrix subtotal name is not located in the fact table, hence the selection function is not picking up the Matrix subtotal name or value. Any idea how to get the matrix to place values in row subtotal for level 1 and 2.
tempsnip

.

Hi, I cannot get the matrix to work using this same technique. That is a matrix with 3-4 hierarchies in the row section of the matrix visual.
I have looked at your financial reporting model report and you only have one level, can you get 3 levels working.

Hi,

Are you stating that I cannot produce a matrix with the financial reporting course method hence redirecting me to the new method.
Cheers
Elizabeth