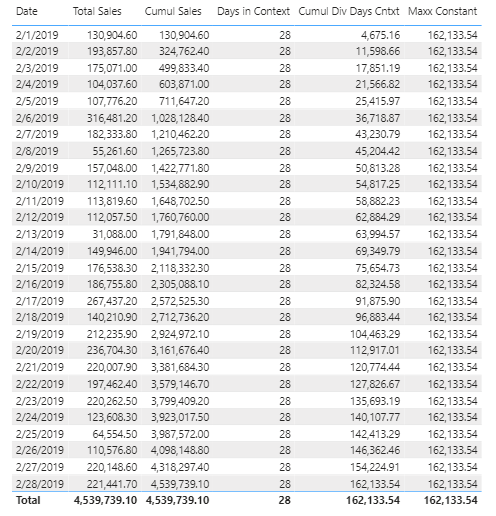
I’ve probably got some easy problem to solve. I’ve got the meassure which is calculating like:
[Acutall Value] * [Monthy Average] * [Days Remain in Month].
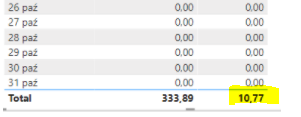
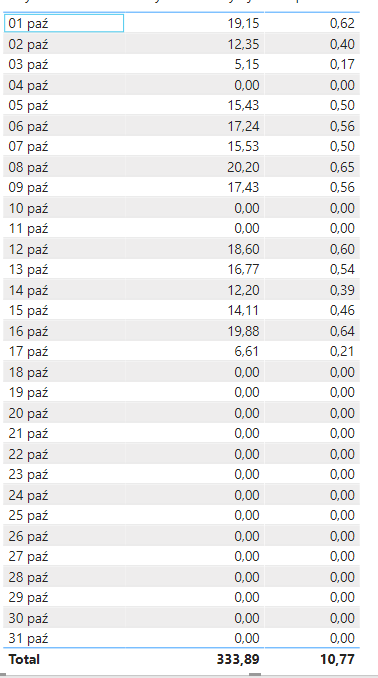
Now I’ve got my result which is 333,89. I would like to show this result as cumulative value.
So I would like to divide that value by the days of actual month.
Problem is that my value is good only in Total like you can see below (2 column).
When I divide that measure by days in month it gives me stupid result (3 column). Actually it gives my result, but only in Total row
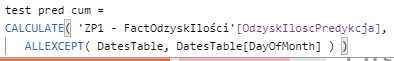
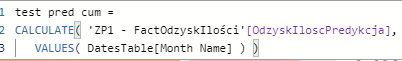
Thanks, but I don’t think it’s that kind of issue. In that post there is a problem with wrong total value. My total is ok, what I wanna do is take that total value and in some kind of way forgot how it is calculating, just want to use that value. Like Copy and Paste Only Values (without formula) in excel
In other words, I want to delete row context and use that context what Total is using.
Measures are always calculated based on contexts like Evaluation and Filter context. Any measure involving an expression like yours will never return a constant value and will depend on Contexts.
If you can share a sample PBIX file, then we will be able to help with your requirement.
As always, @ankit is spot-on. “Defeating” that context and getting a value to display unchanged over multiple rows is harder than you might think. Here’s a thread you might find helpful where @Melissa and I provide two different approaches:
Thanks, those ideas from that link are very clever, but they are doing exactly the opposite, puting value from row to total Isnt there any solution to tell PBI to use Context from Total in all the rows? It seems so simple, but it is so hard to do.
In Power BI, simple things are sometimes most confusing Like SQLBI team says, DAX is simple, but it is not easy. Good blog covering complexity with DAX in comparison to excel/others.
Maybe I should explain why I need this solution. I’ve got my forecast in measure “Value Forecast”. It’s ok for month contex, but you can see in table that results for each day are not usable.
I would like to show that Value Forecast cumulative but only from last blank day in that month and only for working days (In my original file I’ve got your calendar @Melissa so there is column for working days).
The method of calculating the forecast is very important to me because it calculates the forecast for each product separately. Not all products have the same number of days with value, so I can’t count this as a whole.
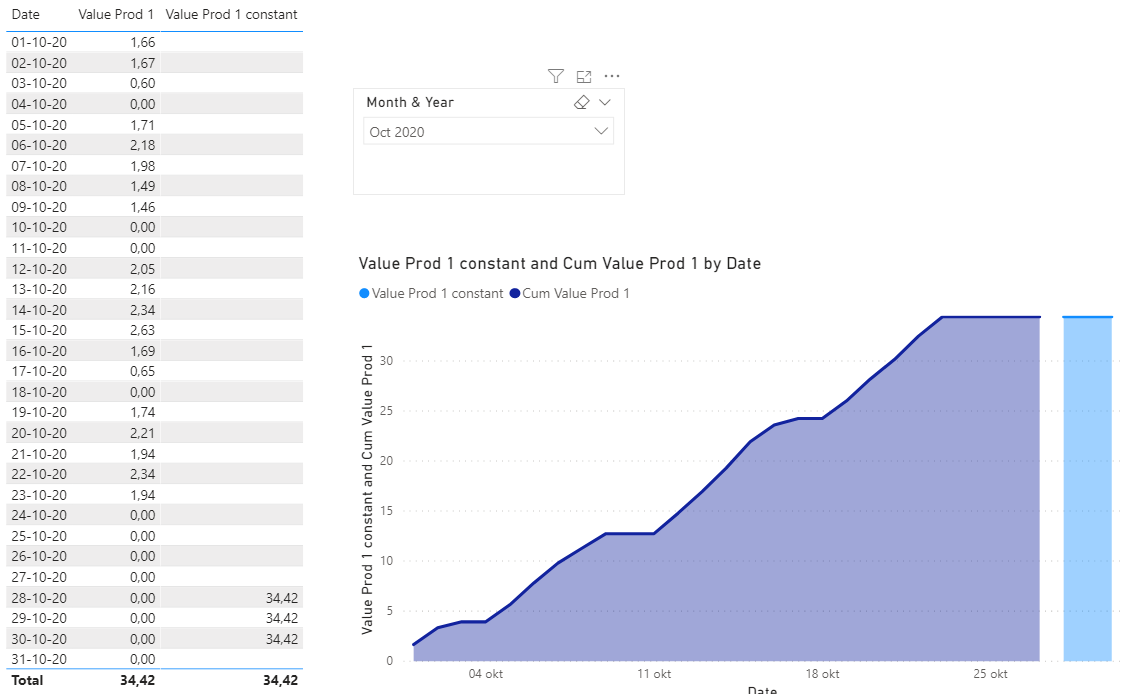
Can you see if this is what you’re after. I chose 1 product to visualize and it’s based on a simple SUM because of the data format you’ve supplied (no PBIX with actual measures).
Hi @wojteq, a response on this post has been tagged as “Solution”. If you have a follow question or concern related to this topic, please remove the Solution tag first by clicking the three dots beside Reply and then untick the check box. Also, we’ve recently launched the Enterprise DNA Forum User Experience Survey, please feel free to answer it and give your insights on how we can further improve the Support forum. Thanks!
Thanks @Melissa, it’s good to know that I can so quickly use total value of another measure.
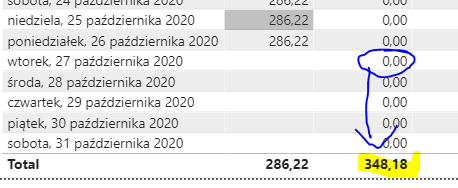
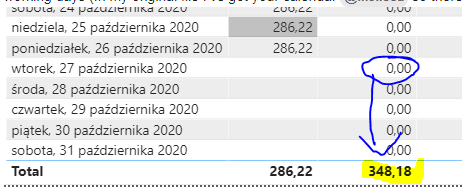
But unfortunetly, that is not solving my problem. That average value is counting from my forecast value. So I would like to show that average value (34,42 in your file) cumulativily, but only from the last day when the value of my value that I’m forecasting appears.
286,22 is my actual value. 348,18 is my forecast. I want to show my forecast cumulativly but from day 27 in this case. I need this to my area chart when actual value line is connected to forecast cumulative line which is shown until the end of the month. This way I can see the potential value of the whole month cumulatively.
I’m trying to make your suggested measure cumulative but it’s not working fine.
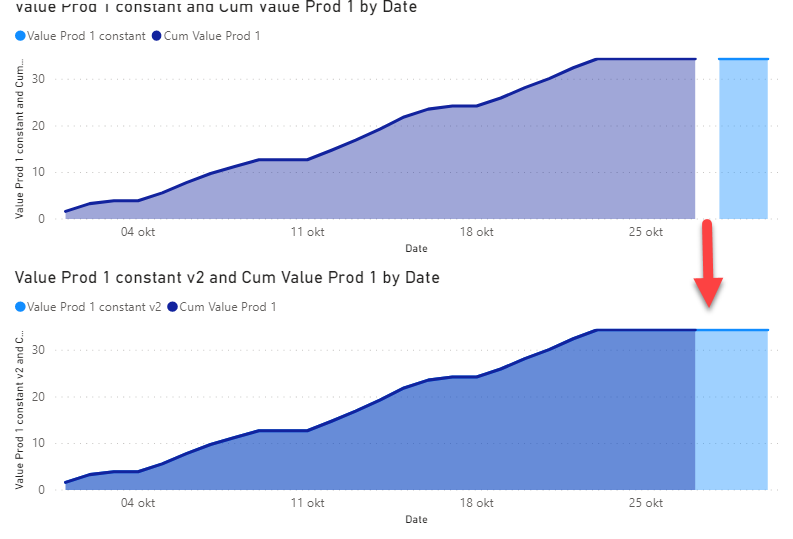
Okay to have the lines touch, there has to be an overlap of 1 day. However the most simple fix would be to just project the lines on top of each other, like so:
Hi @wojteq, a response on this post has been tagged as “Solution”. If you have a follow question or concern related to this topic, please remove the Solution tag first by clicking the three dots beside Reply and then untick the check box. Also, we’ve recently launched the Enterprise DNA Forum User Experience Survey, please feel free to answer it and give your insights on how we can further improve the Support forum. Thanks!


 It seems so simple, but it is so hard to do.