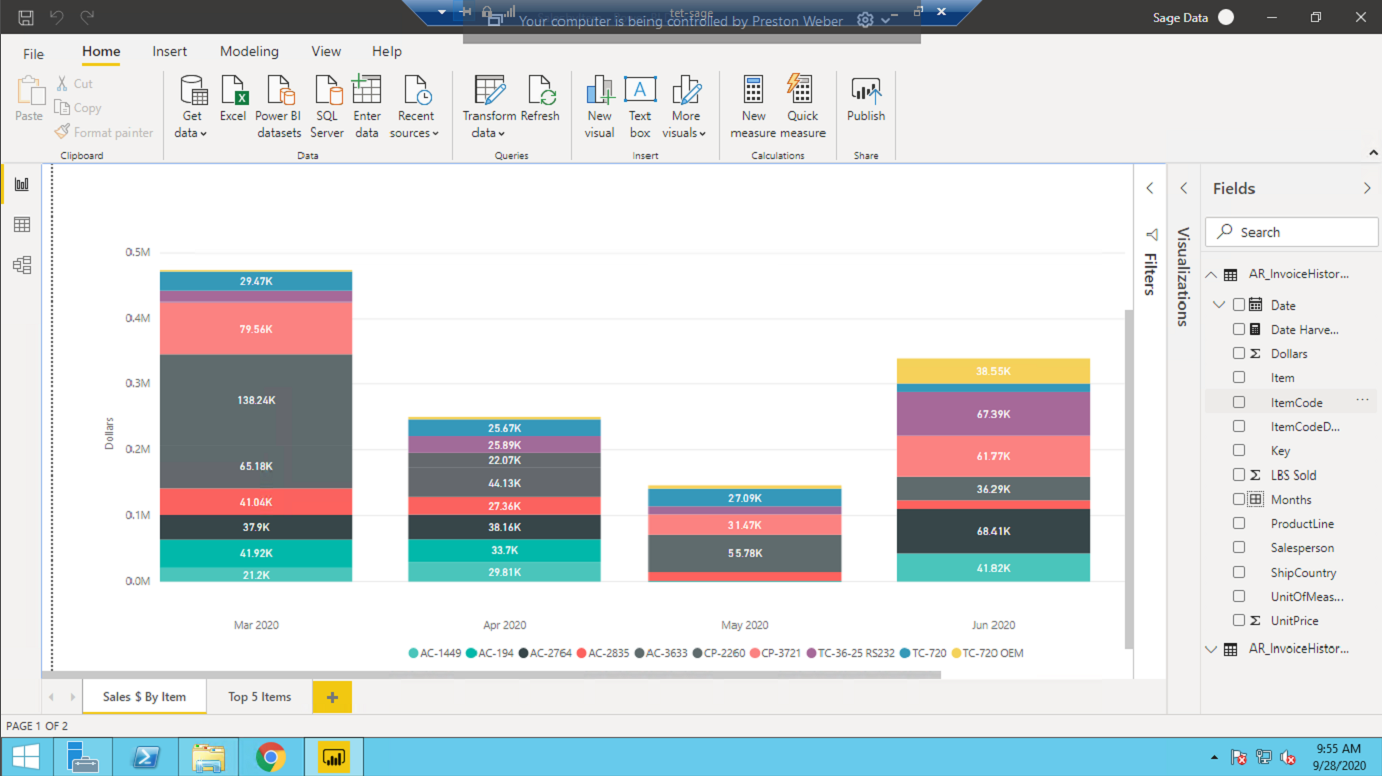
I am having some trouble getting my PowerBI visuals to sort by dollars inside each bar. Below I have a graph that is grouped by month, inside that month it shows sales (dollars) by item, I want the largest dollar amount for each month to be at the bottom and then moving up accordingly. Instead its sorting by item code. I have tried putting this data in a table and then sorting the table accordingly and then switching the visual back to a stacked bar chart but it doesn’t work.
I have also went into the tables and sorted the data by the dollars measure as well that hasn’t help either.
Just to get going. You can try the following steps for the reference -
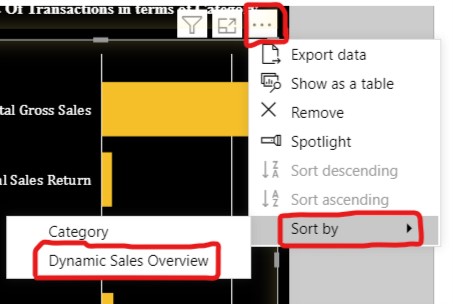
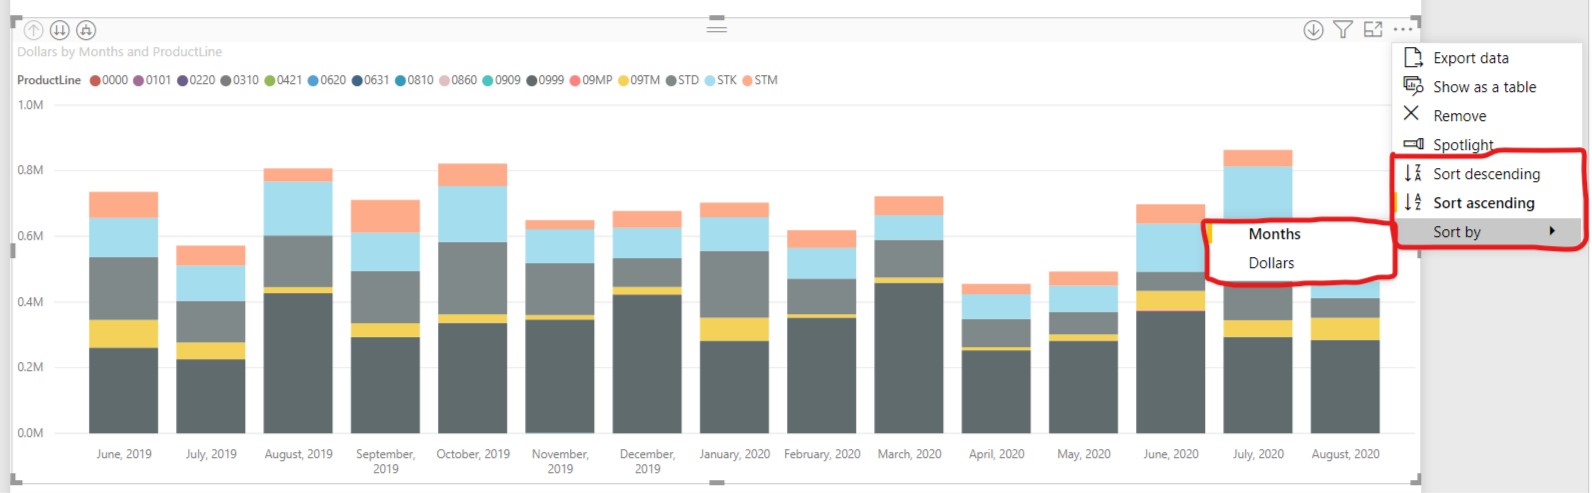
Click on the 3 dots ellipses (…) >> Go to the “Sort By” option >> Under that, change the sorting from Category to the “Dollars” >> And then select the “Sort Descending” option.
Below is the screenshot provided for the reference -
Hoping you find this useful and meets your requirements.
@Preston I am not sure I know of a way to do what you want, but I was wondering if you had considered a ribbon chart? that will sort the values from high to low for each x-axis value:
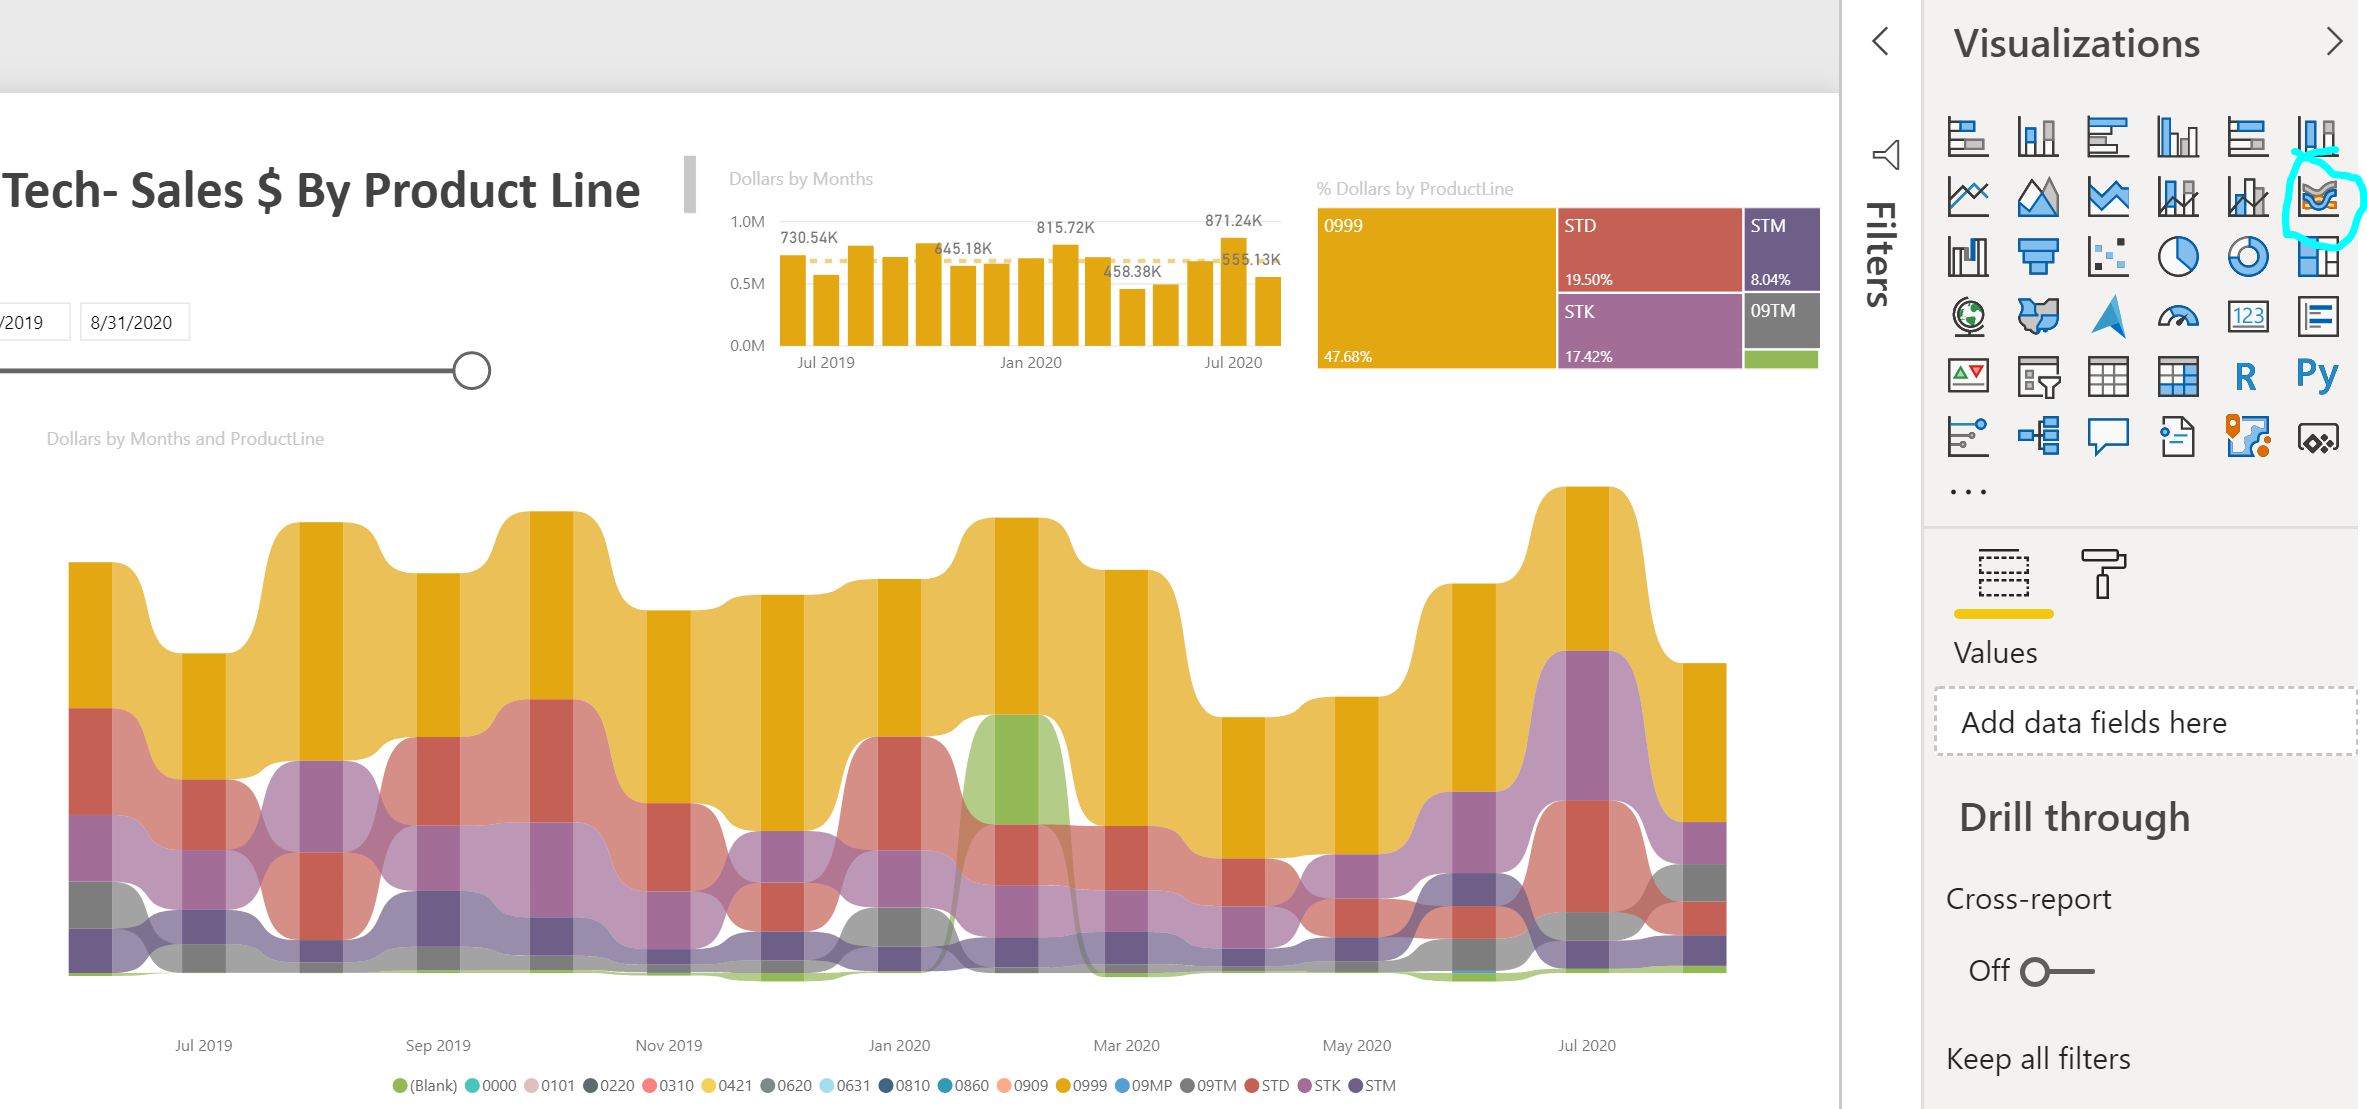
After looking at the PBIX I managed to activate the sorting option that was not visible in your case. But the thing is if your try to do/apply the sorting in your “Line and Stacked Column Chart” it won’t provide you the desired results that you’re trying to achieve. Below are the steps mentioned alongwith the screenshots provided for the reference -
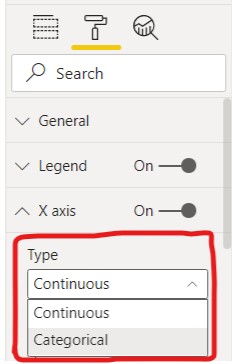
Step 2:In order to activate the “Sort By” option. Go to the Format tab and under that “X-Axis” option, change the “Type” from “Continuous” to “Categorical”.
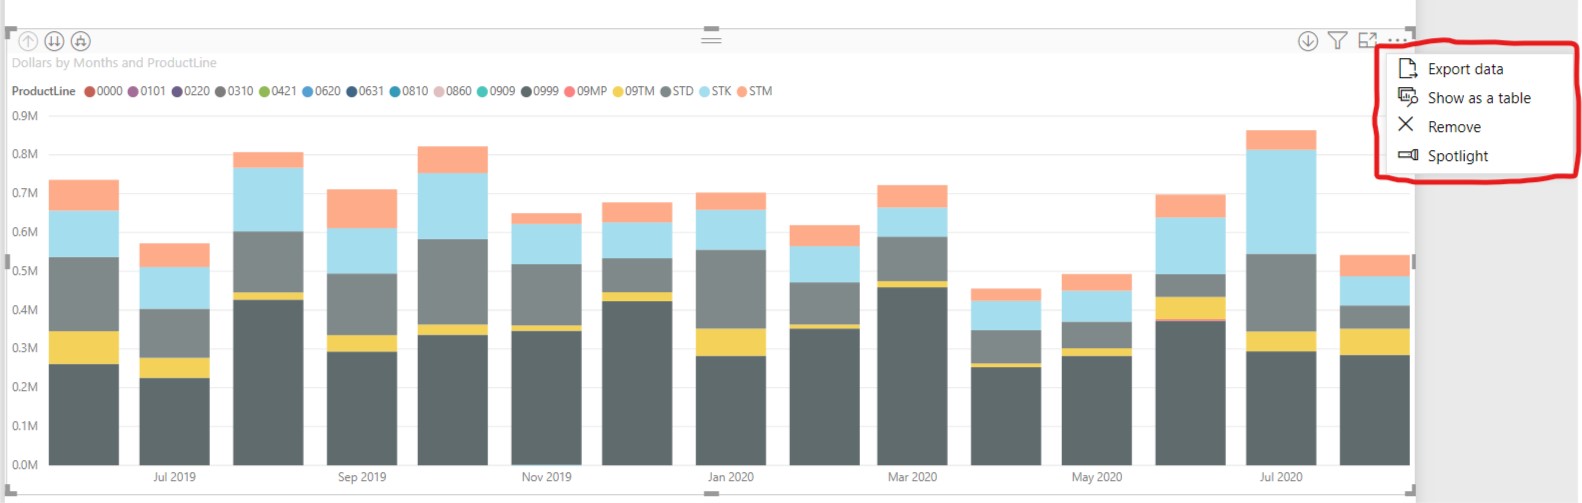
Step 3:Now, you can check under the 3 dots ellipses that “Sort By” option is activated. (Note: Observe the months on the X-Axis by comparing it with screenshot No.1)
Step 4: Now, if you try to sort them by “Dollars” in “Descending Order”. You would expect that individual bars would be sorted from Descending to Ascending but rather than doing the sorting in that manner it will actually sort the months from highest to lowest by comparing the dollars over a period of time. Below is the screenshot of the end result provided for the reference -
Conclusion:The Bar Chart will sort the X-axis rather than sorting the categories that contains within the individual line items.
I’m also attaching the working of the PBIX file for the reference. And also providing a link below where similar sort of query was asked onto the Power BI Community Forum where no solution is available for it yet.
My apologies but I guess this is as of now one of the limitations in the Power BI.
Hi @Preston, did the response provided by the contributors help you solve your query? If not, how far did you get and what kind of help you need further? If yes, kindly mark the thread as solved. Thanks!
Thanks a lot for the quick insight and time spent on this! I was honestly thinking that it was not feasible but just wanted some verification, I scanned PowerBI forums but did not come across that article. Thanks very much!!