In a Financial Report, it it possible to color the Total Row?
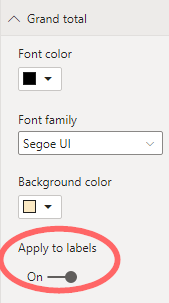
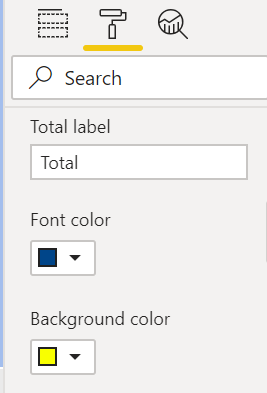
Yes. Just select the visual you want to color, click the paint roller icon to format, scroll down to select the format options for “Total”, and then change the background color and/or text color.
- Brian
Hi Brian,
Thank you but my problem is different. I have designed an income statement template where I am populating values against the template like I have Total Revenue and Total COGs and then individual item I just want to color the total Revenue and Total COGS
Unfortunately, I don’t think this is possible yet.
There are over 3,600 votes for this capability in the “Ideas” section of the Microsoft Power BI community forum, but it hasn’t been implemented yet. I’m sure it will be at some point, but doesn’t look like it’s a current top priority.
If you want to post your PBIX file, perhaps there is a kludgy workaround based on the matrix conditional column formatting capabilities…
- Brian
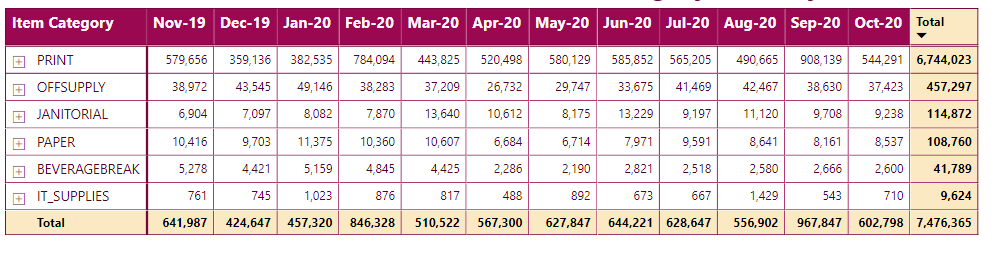
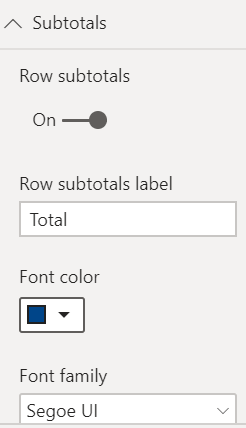
Wait – scratch that last post. Conditional formatting for subtotals is still not available, but the basic ability to highlight subtotal rows is. Click on matrix visual, click the paint roller, scroll down to “Subtotals” and you can set your highlight and font color there.
- Brian
Hi Brian,
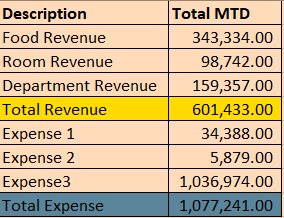
Thank you but I am not using default matrix “Sub Total”, In fact I have disabled that. An example of an Income Statement would make clear.
I am using a template, please let me know if further details are required.
OK, thanks for the clarification. I understand the issue now.
It would help if you could post your PBIX file, so that I can check this approach, but I think the following will work assuming your template is set up similarly to this video:
Assuming you have a row number/index column in the table that contains the row header labels, add a calculated column called Highlighted. Using a SWITCH/TRUE() statement, set the Highlighted column to 1 for the row numbers you want to highlight, 0 otherwise (or if you want to use different colors for different highlighted rows, choose a different number for each color you want to use). Then in the Field Values section of the conditional formatting options, for the Description and Total MTD fields, you can set the background (highlight) color based on the value of the Highlighted column, using the “Advanced controls” options.
I hope this is helpful. If not, please post a PBIX and we can work through the issue with your specific data/model.
OK, I put together an example using Sam’s Financial Reporting Showcase data. Here’s the DAX for the Highlight calculated column for the two rows I chose to highlight:
Highlight =
    SWITCH( TRUE(),
    'Financial Categories'[Financial Statement List] = "COS - Equipment", 1,
    'Financial Categories'[Financial Statement List] = "COS - Prize Fund", 1,
   BLANK())
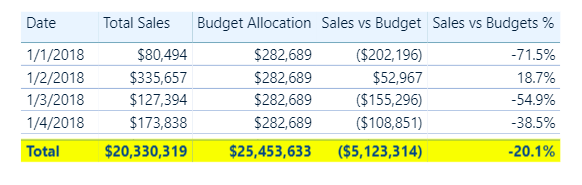
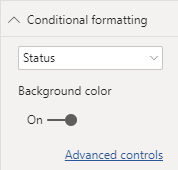
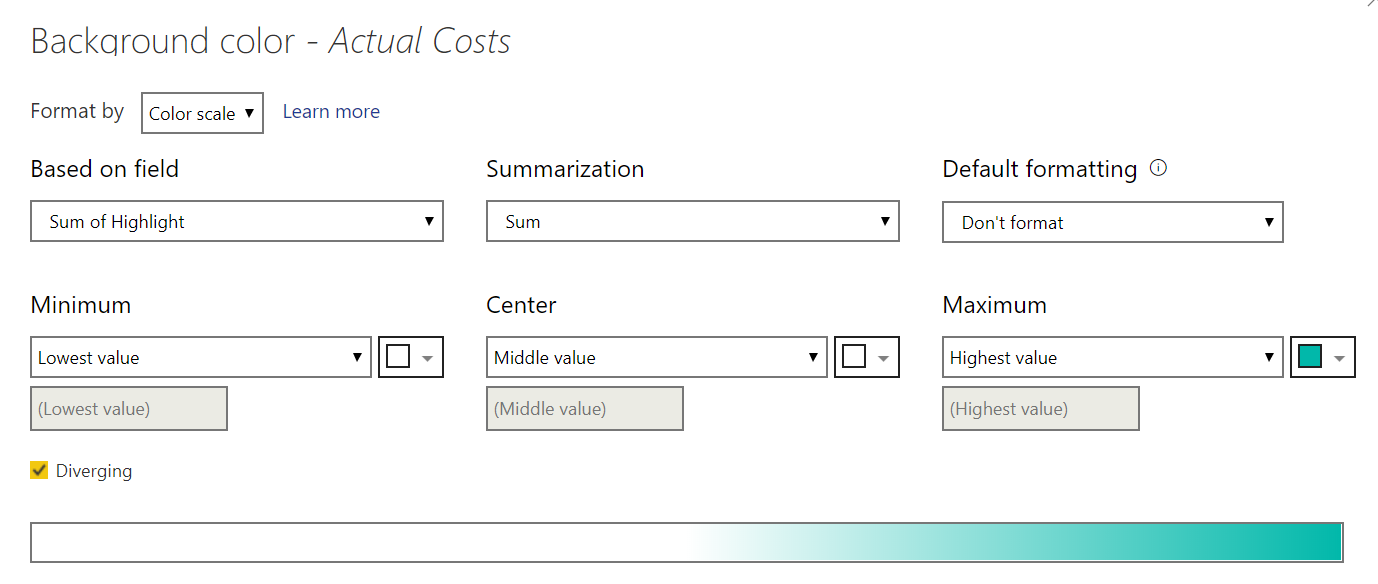
Then just conditionally formatted each of the fields in the table based on the value of the Highlight column. The key is to set the value of the highlight column to blank for all the rows you don’t want to highlight. Then, in the “Default formatting” section of the conditional formatting dialog, choose “don’t format”
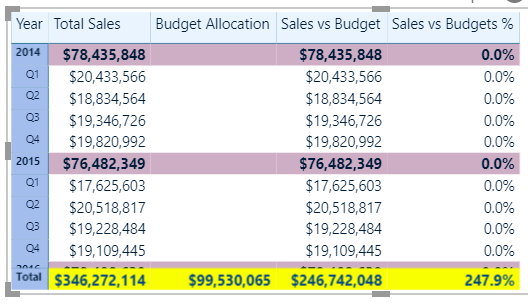
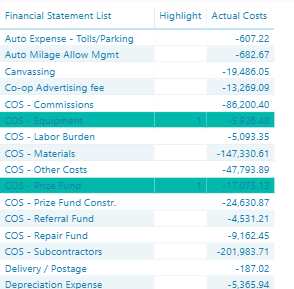
Here’s how my sample table looks (I included the Highlight column just for illustrative purposes). You can conditionally format the font in the highlighted rows in the same way if you choose, though I didn’t bother to here:
I hope this is helpful.
- Brian
2 Likes
Hi Brian,
I managed to get this working, wow what a great technique!
Thanks so much!
Great – glad to hear that was helpful. Microsoft has been putting a lot of emphasis on expanding the conditional formatting capabilities in the recent monthly updates, so hopefully soon there will be an easier way to do this. But in the interim, I’ve found it to be a decent workaround.
- Brian
Hi,
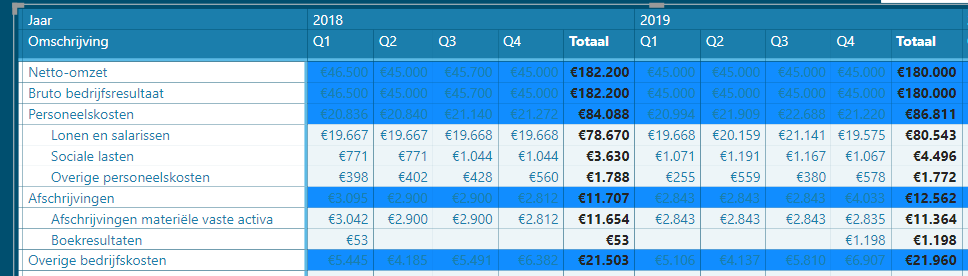
I’m searching for a way to highlight specific rows , and I also want to highligt the row headers. I have a matrix visual and used the technique from this topic. I have managed to hightligh the values itselves, but it would be much better if also the row names (Omschrijving) are highlighted.
Does anybody know if this is possible?
Thanks, kind regards,
Marieke