Hi,
I am working on a data set with couple thousands of rows but with more than 300 columns/variable. Most of the variables are categorical and there some continuous. I need to get descriptive statistics including frequency for categorical and measures such as mean, median, std, etc for others. In any statistical packages such as SAS, SPSS, JMP you can just drag and drop as many variables as you want and in one run get the descriptive. Is there a way to accomplish the same in Power BI? any custom visualization you are aware that can handle this? The only method that I can think of is to use either R or Python. Any thoughts/suggestions?
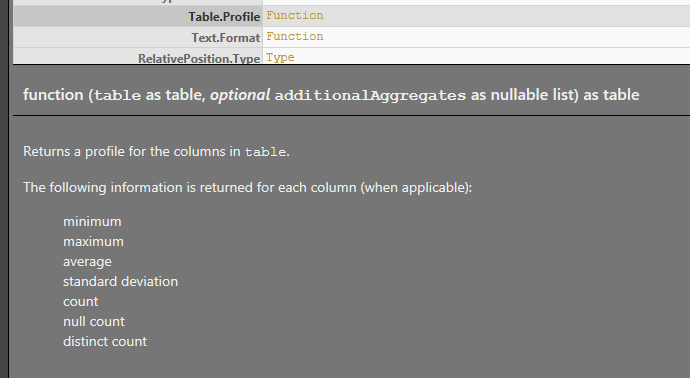
I have used Table.Profile function for most part. Now, the requirement somewhat changed and I need to get more stats on multiple variables. For example, on continuous variables such as age, total scores, etc… I need to get N, Mean, Median, STDV, Min, Max, and IQR (Interquartile range),
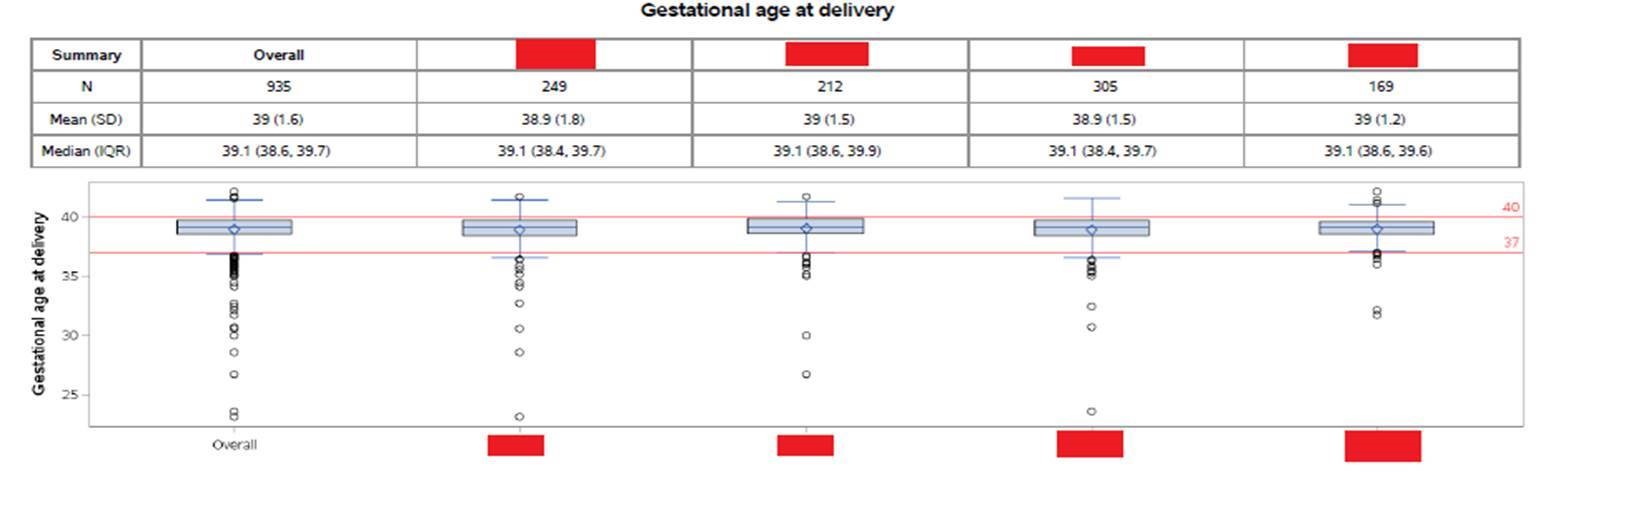
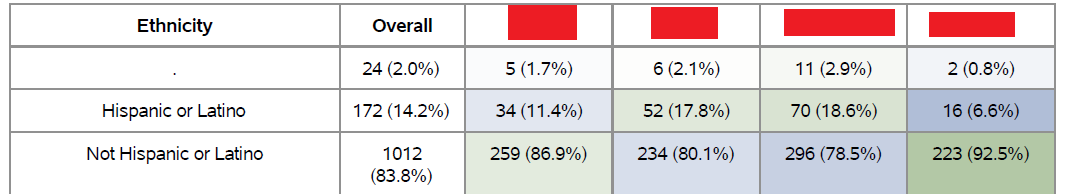
and Box plot graph by let’s say sites or clinics (See attached BoxPlot picture and formatting). For categorical, N, column % by let’s say sites or clinics ((See attached Category example picture and formatting). I can create these measures easily and format the report accordingly. However, I Have 80 different data sets with more than 1500 variables. Therefore, creating these measures for 1500 variables would take forever and Table.Profile wouldn’t give me all of the stats + Box Plot that I need. Any suggestions?
Hi Nick,
Table.Profile took care of stats for categorical variable even though I am still having a bit of issue to apply to all variables in the data set. Major issue is with continuous variable according to requirements; namely creating Box Plot and show stats on the top of that. Any solutions for these type of variables?
I will ask @EnterpriseDNA to break this thread into a separate topic starting with post #5.
One question I have for you is whether using R is a possibility? Because what you could do is shape your data as needed in Power Query, invoke an R script from within Power Query to calculate the descriptive statistics you need easily and then have it output those results seamlessly back out to Power Query, all within the same query.
For an example of this technique, you can see our Data Challenge #11 write up, where we used the same approach to retrieve regression results that were then fed back into a Power B native scatterplot visual.
Hi Brian,
R or even python good possibilities. I am currently doing it all, descriptive and graphs, fairly easily in JMP Pro. The question for me is I have to resort to R or Python to curate data, why do I need to add another layer and bring them back to Power Query? I might as well automate and produce the results by either applications and distribute them. Of course, the only major drawback is distribution of the results created in those applications while it’s fairly seamless and easy with Power BI.
I strongly believe that Power BI needs to have a seamless integration of statistical modules and not as separate or embedded applications such as R or Python. I am not an expert so I may be overlooking things that I am not aware of. There are two major obstacles, at least what my colleagues are telling me, of not using Power BI in academics. First, in today’s commercial stat applications like SPSS, SAS, JMP, Stata, etc…wit one drag and drop you get basic stats, graphs, and more even if you have couple thousands variables. Second, and almost as easy, id doing sophisticated analytics/statistics with those stats packages. Again, I am not be aware if Power BI has such capabilities. The close resemblance that I am aware in Power BI in Table Profile and being able to customize that with DAX. I am not aware if Table P can Profile can be customized to include graphs and apply for 1000 variables. the simplest answer I received from some experienced Power BI developer is Power BI’s main target users are not academics! Any thoughts?
Very fair question. For me, the answer is that Power BI is a nearly perfect analytical “home base”. It’s better than anything else I’ve seen at creating a seamless, intuitive user experience, while being able to integrate the best features of other analytical tools. I think the COVID dashboard that we (the JMAP team) created for Data Challenge #11 illustrates this well. In addition to the Johns Hopkins data, we pulled in probably close to a dozen other data sources, did our regression analysis and significance testing in R, our geospatial mapping analysis in Icon Map, custom visuals in Charticulator, etc. and all of that was completely invisible to the user who just saw (hopefully) an attractive, intuitive way to explore and analyze pandemic data.
Personally, I am fine with Power BI not including anything more than rudimentary statistical functions because the integration with R is so good that I would rather just take advantage of the 20,000+ custom packages available to do any sophisticated analysis I could imagine, and then just pull those results easily into Power BI.
Similarly, if you look at some of the amazing machine learning analyses that Enterprise DNA Expert @bradsmith is doing, he is also using Power BI extremely effectively in this “integrator” role, incorporating the best machine learning algorithms and capabilities from Python and R together in a seamless report.
However, I don’t work with datasets with nearly as many fields as you do, and so the size and complexity of your data ultimately may be better suited to some of the tools you mentioned. With regard to business versus academia, I do think it’s true that Power BI is marketed most directly to business users and I have no idea what level of traction it’s gaining within academia. However, I do know that eDNA members @Tanzeel and @dsirias are university professors using Power BI extensively, so they may be able to offer insight into that question.
Brian,
Thank you for sharing your insightful on Power BI. This has helped me to better understand the scope of Power BI in a broader perspective excluding technical jargons.
Hi Brian,
I have posted another questions that I am still waiting to get some directions on. Keith has asked that I post a pbix file and I did and still no responses. How can I promote it on the forum to get some advice? The post titled “Entire Table Columns Extraction with Slicer Selection”