How to calculate Headcount over time

Hi,

I was trying to solve an issue in PowerBI, which I thought, should be an easy task. Unfortunately it isn´t - at least - not for me. After trying several approaches without any noticeable progress, I wanted to ask for your support, before it drives me crazy :blush:

Here is the scenario:

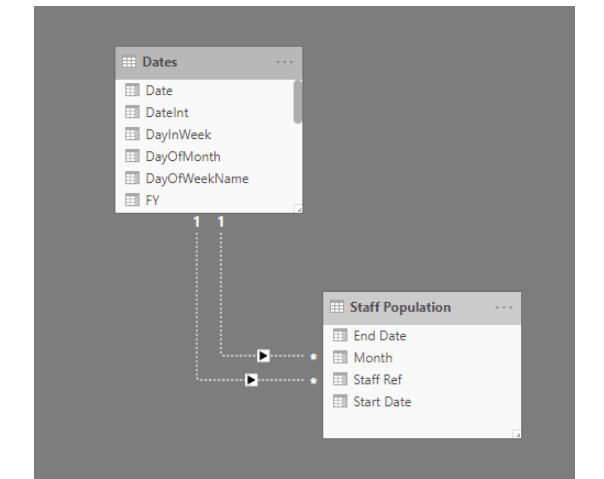
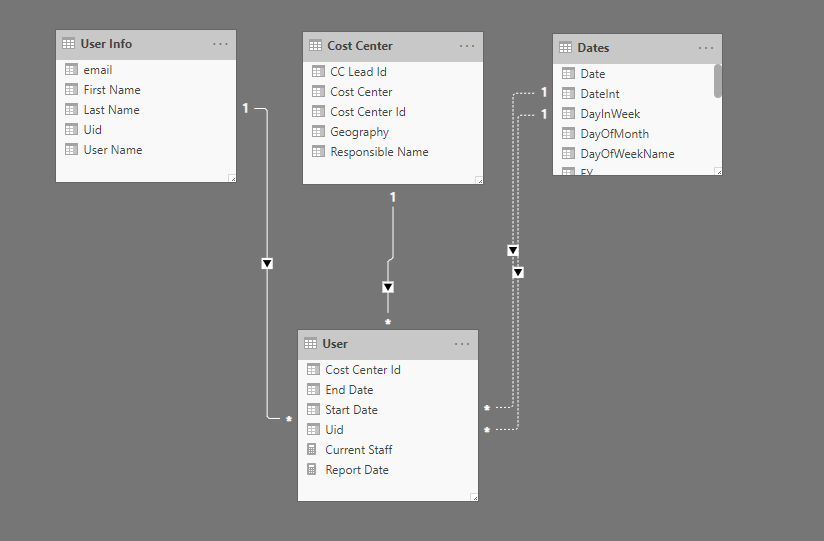
  • We have several Cost Centers in different locations.
  • Each Cost Center has a Cost Center Lead and some Users
  • Each employee (Lead and Users) have a defined Start and End Date
  • Employees can change Cost Centers and/or become Cost Center Leads
  • Cost Center Leads can change Cost Centers as well

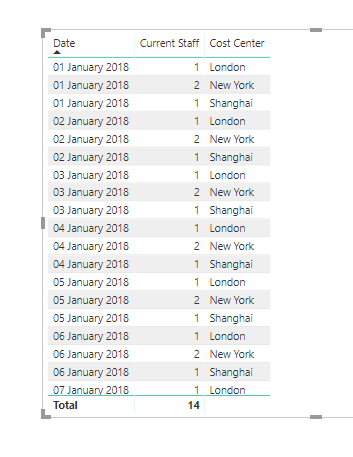
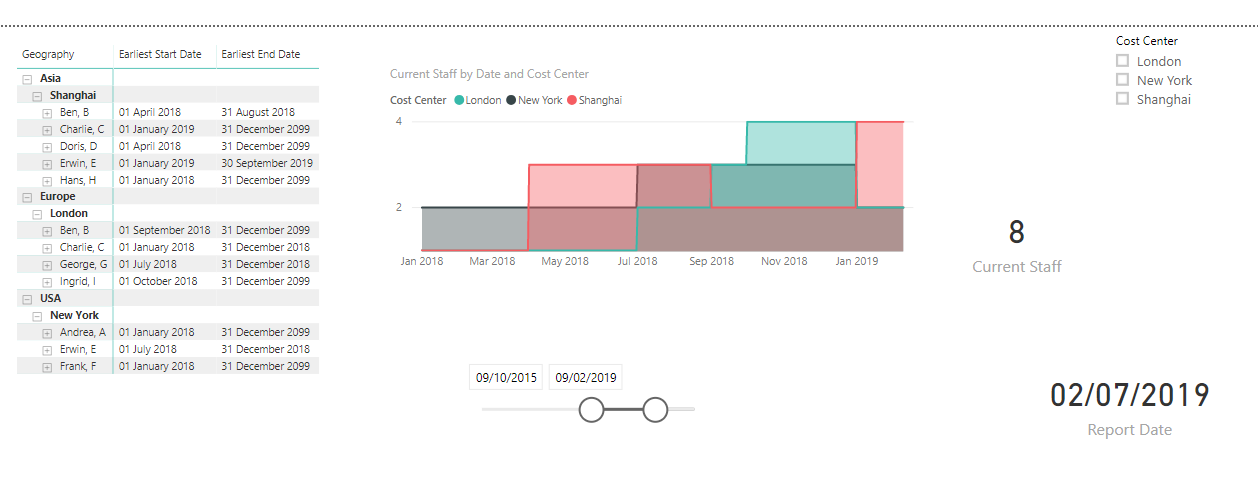
Now we simply wanted to know, how many employees we had at a certain time in each Cost Center, and which employee was the lead at that time.

This should be charted as number of employees, by Cost Center and Lead over time.

Please find a simple dataset in the attached file.

Thanks in advance for your support and looking forward to hearing from you, how this problem can be solved.

FrankEmployeeHeadcount.xlsx (11.5 KB)

Hi Frank,

I’ve seen this question a few times and I believe I have the solution for you.

It’s similar to this forum post here.

And here.

It’s all about managing multiple dates in your fact tables like you have here.

I have recently created a video describing how to work with this.

See here…

I have another tutorial being release in the coming weeks around this specific case as well.

But the techniques are all the same.

You need a model that looks like this

image

Then a formula combination like this.

Current Staff = 
CALCULATE( COUNTROWS( 'Staff Population' ),
    FILTER( VALUES( 'Staff Population'[Start Date] ), 'Staff Population'[Start Date] <= MAX( Dates[Date] ) ),
    FILTER( VALUES( 'Staff Population'[End Date] ), OR( 'Staff Population'[End Date] >= MIN( Dates[Date] ), ISBLANK( 'Staff Population'[End Date] ) ) ) )

Check out the resources I’ve placed here and you’ll see exactly what needs to be done for this.

Thanks
Sam

Hi,

thanks for the quick and effective feedback, which quickly solves one of the problems.
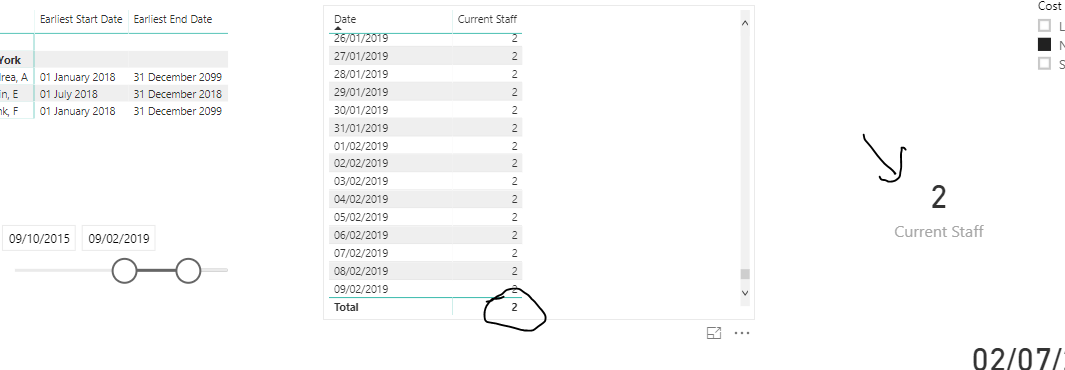
Upon applying your formula, the chart updated correctly. However the table and the card in the attached example are showing wrong results.
Also I need a distinct value for a given date, as I have to do some calculations on the headcount.
The User should be able to select a month and year, and the resulting headcount at this time should be displayed and be useable for further calculations.
Looking forward to another great feedback.
Best regards
Frank

PS: Glad to be a member :slight_smile:

Headcount_Example.pbix (268.7 KB) Headcount_Example.xlsx (12.4 KB)

Ok cool, few things here.

Try to get your models looking a bit more like this

I detail why in this module here if you haven’t gone through it yet.

Then the other thing to always do first when working through calculations, always keep the results in a table so you can actually see the numbers.

This helps a lot in understanding what is going on.

image

So the total is actually calculating as it should based on the formula being applied here.

It’s calculating how many staff you have had through time rather than staff numbers on the last date.

I can see this easily when the data is in a table because that’s what the total is showing there.

To also get the total to be the very last result we need something a little different.

Like the below.

Current Staff = 
IF( HASONEVALUE( Dates[Date] ),
    CALCULATE( COUNTROWS( 'User' ),
        FILTER( VALUES( 'User'[Start Date] ), 'User'[Start Date] <= MAX( Dates[Date] ) ),
        FILTER( VALUES( 'User'[End Date] ), OR( 'User'[End Date] >= MIN( Dates[Date] ), ISBLANK( 'User'[End Date] ) ) ) ),
        CALCULATE( COUNTROWS( 'User' ),
            FILTER( VALUES( 'User'[Start Date] ), 'User'[Start Date] <= MAX( Dates[Date] ) ),
            FILTER( VALUES( 'User'[End Date] ), OR( 'User'[End Date] >= MAX( Dates[Date] ), ISBLANK( 'User'[End Date] ) ) ) ) )

These are the end results I’m seeing now which look correct but you’ll have to check.

Thanks
Sam

Hi,

Thanks again for the incredible feedback. Seems you never sleep :slight_smile:

Think I have to ponder about the formula for quite a while, to understand what´s going on. The Current Stuff card is showing the correct result :+1:

Beside this, a have a question: Why is the table not filtered to the report date and what is the connection between the Report Date Card and the slicer, as they show different dates?

Thanks again and best regards
Frank

Check out this recently released video for more details on this technique

The table is not filtered because of the inactive relationships. These don’t actually naturally filter anything because they are not active.

That’s really the trick behind this technique, you turn on the filter inside the formula.

Sam

1 Like

Hi all,

Many thanks for all the answers and help that you are providing.
I was able to apply the measures correctly and I have the correct Staff headcount per period.

However, in my model I would like to calculate the Yearly average.
I have tried several ways without any success.
If you can help that would be amazing.

PS: I’m not attaching a model, because it would be the same as Sam is using.

thanks in advance
Kind regards
Miguel