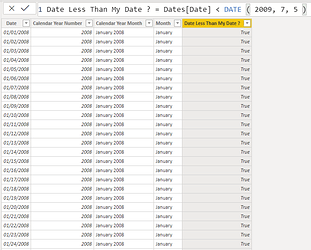
If you ever want to create a visual with Running total and hide dates after a certain date then you can first create a calculated column in your date table like this:
Date Less Than My Date ? = Dates[Date] < DATE ( 2009, 7, 5 )
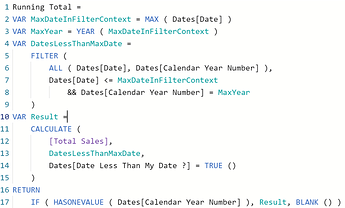
After that create a visual with your date hierarchies, I generally use Matrix, and then you can create a piece of DAX like this one
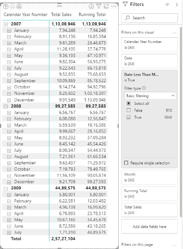
And then add a new filter through the filter pane by using the column from the dates table created in the previous step, like this:
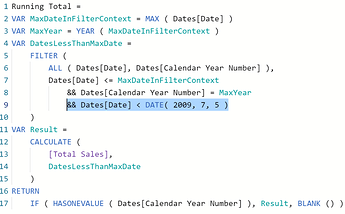
Instead of going through the hassle of creating a new calculated column and adding a filter using it you could add the logic in DAX too but then you would have to manually filter months in the Filter pane. while in the former you only need to select True.
Running Total =
VAR MaxDateInFilterContext =
    MAX ( Dates[Date] )
VAR MaxYear =
    YEAR ( MaxDateInFilterContext )
VAR DatesLessThanMaxDate =
    FILTER (
        ALL ( Dates[Date], Dates[Calendar Year Number] ),
        Dates[Date] <= MaxDateInFilterContext
            && Dates[Calendar Year Number] = MaxYear
    )
VAR Result =
    CALCULATE (
        [Total Sales],
        DatesLessThanMaxDate,
        Dates[Date Less Than My Date ?] = TRUE ()
    )
RETURN
    IF ( HASONEVALUE ( Dates[Calendar Year Number] ), Result, BLANK () )


