Help with SUM and COUNT ignoring filters

Hi,
I would like to ask for some help with the need for aggregating (sum and count).

The same aggregation need occurs in two different data models. In the first situation I have one table containing all details and in the second situation the data is split over several tables.

First data model:

This is in fact a simplified example for a data model that in reality consists of 15.000 buildings, owned by 1.500 companies in many cities. The end user wants a table in the Power BI report which lists the companies, with the possibility to filter for a specific region, showing the number of buildings and the sum of their capacity for both the entire company and for the selected region. Like this example (filtered with City = New York):

Preferably displayed like this in the report visual:


This way of presenting requires a separate measure with some concatenation of the Company name with both calculations or perhaps it requires the use of a calculated column.
I managed to create a DAX measure for “No. of Buildings in selected area” and a DAX measure for SUM of Capacity in selected area. The problem for me lies in the Total no. of Buildings and the Total sum of Capacity and the integration of these values with the company name in a single field.

Besides the struggle with the DAX formulas, I am also wondering whether to perform these calculations through a DAX measure or to create these columns in Power Query. With regard to performance and given the fact that the Total no. of Buildings and the Total sum of Capacity will stay the same regardless what filtering takes place by the end user, I can imagine it’s worthwhile to calculate these columns in Power Query.

If so, I would like to extend my Building table in the query editor with two columns, like this:

I am aware of the fact that I create data redundancy here and it would be better to have a separate table holding all company details. But my data source holds only this one table and otherwise I first have to extract all unique companies in a separate table creating some other difficulties and performance issues.

So my questions are:

  1. Is it better to perform these calculations in Power Query or in DAX?
  2. How to work this out, either in Power Query or in DAX language?

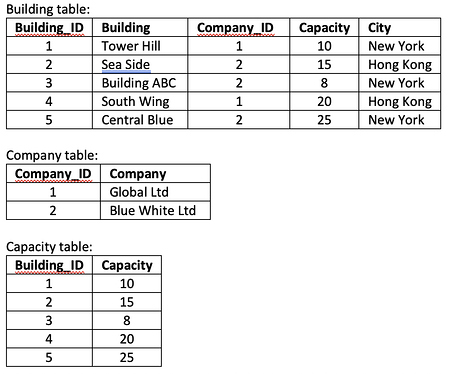
Last but not least, I have a similar situation, but with a data model consisting of three separate tables:


Also in this situation I am aware of the imperfection of the data model. I could consider an append of the Building table + Capacity table, but in reality this capacity table holds almost a hundred different columns, with capacity data for many moments in the past and forecast for the future.

For this data model I face the same challenge of calculating the total number of buildings and sum of capacity for each company, regardless any filters.

Thanks for all useful suggestions!

Hi @Sebastiaan.

You should be able to get what you want by using simple DAX measures to calculate both the number of buildings (and capacities) in the selected area (using the data model) and the total number of buildings (and capacities) for the company (using the CALCULATE function and filtering for all cities). Then you can use a CONCATENATEX function to compose your desired {Company (buildings | capacity)} string.

Hope this helps.
Greg
TEST Buildings.pbix (70.6 KB)

3 Likes

@Greg, I like your approach. 1 word to describe it. Optimal.

Thanks Greg,

This seems to work! Thanks for working that out in a sample file!

A few remaining questions:

  1. You created a sample file with a preferred snow flake or star-like data model. My data source starts with a single buildings table holding all attribute-columns (instead of separate dimension tables). How can I extract in Power Query a unique list of each attribute (like company, city, etc.) and create a separate dimension table for each attribute, with a separate column for a unique ID? Or is it not worth the hassle to split my primary fact table in separate dimension tables?

  2. In reality, City is not the only dimension the end-user can filter on. We also have Region, Country, and even through the filter panel the user can filter on dimensions in other -related- tables. How would that influence the DAX formula:
    CALCULATE( [Capacity of Buildings in Selected Area];
    ALL( Cities ) ) ?

Do I have to list after Cities all other possible columns the end user can filter on, like:
… ALL(Cities), (Region), (Country))?

And suppose we have a column named “No. of employees” in the Company table which is available for the end-user to filter on. How to include that one?

  1. FORMAT( [Total Number of Buildings in All Areas]; “#,#” ) ensures that the thousands separator is used for numbers > 999 ?

  2. What about the idea of solving this in Power Query for performance reasons? I assume the measures ‘Total Capacity of Buildings in All Areas’ and ‘Total Number of Buildings in All Areas’ both wil be calculated over and over again each time the end user changes a filter or slicer.

Thanks a lot for the great help so far!

Regards, Sebastiaan

1 Like

Hi Greg,

I did encounter a small issue with your approach. Your visual starts with a column Company ID. When I remove this column from the table visual the "Company ( buildings | capacity) doesn’t show correctly anymore:

I know I can solve this in this table visual by setting the width for the first column Company ID to zero, but that doesn’t solve all my needs. I would also like to use this expression “Company (buildings | capacity)” on the axis of a bar chart, etc.

Does this mean we better create a calculated column for this expression (although calculated columns are to refrain from :grinning:) ?

Regards, Sebastiaan.

see the video below on how to create separate tables - with very large datasets, this can be a very good practice to reduce the size of your file.

Hi @Sebastiaan. Here’s a few thoughts on your remaining questions:

  • data model layout: I always prefer star or snowflake schema models - I think its always well worth the effort and is much easier to visualize and will ultimately perform better once you remove unnecessary column from your main fact table; there are plenty of resources online which document the steps to extract a dimension from a fact table, but quickly the Power Query steps would include some of:
  1. reference/duplicate the fact table and rename as your new dimension,
  2. remove unnecessary columns, then remove duplicates from dimension, then add index,
  3. from fact table merge with new dimension, keep only index, then delete no-longer-necessary text column from fact table,
  4. use Relationship View to verify link between your fact table and your new dimension
  5. rinse and repeat for all desired dimensions.
  • additional dimensions: should work just fine; the only location-specific DAX is for the “All Areas” calculation which should still apply
  • ALL(Cities), (Region), (Country)): I don’t understand the question/your issue
  • no. of employees: you should be able to add a “No. of Employees” column to the company table and include in the visuals you wish - it should just work
  • FORMAT: mine was a quick-and-dirty solution using “#,#”; I think the preferred version for the format string is “#,##0”; again, check online for examples
  • performance and Power Query: I’m very visual, and unless there are compelling performance reasons, I usually prefer to use the UI for my calculations instead of Power Query; as a consultant I most often do what is easiest for subsequent developers to read, and M code knowledge is not yet widespread; I do agree that using M code would likely be more performant, and perhaps others who are better-versed in M code than me can elaborate
  • Company ID: yeah, I hear you … it was a bit of a hack to get the table to look like what you asked for; I as well always prefer using a measure rather than a calculated column, but it’s worth giving a calculated column a try.

Hope this helps.

Greg

1 Like

Hi @Sebastiaan, a response on this post has been tagged as “Solution”. If you have a follow question or concern related to this topic, please remove the Solution tag first by clicking the three dots beside Reply and then untick the check box. Also, we’ve recently launched the Enterprise DNA Forum User Experience Survey, please feel free to answer it and give your insights on how we can further improve the Support forum. Thanks!