Good Morning,
I’m looking for some help me with writing a DAX calculation which would create an average based on segments that I have created.
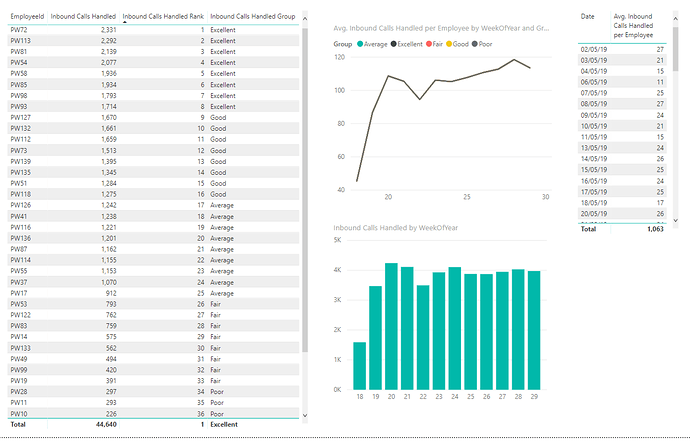
To give a bit of background, I am creating a report based around the performance of our CSA, looking at the call volume they all handle. I have already followed the “Segment Data Based On Percentage Groups - Advanced DAX In Power BI” video and have managed to rank all the employees by the number of phone calls they handle. Furthermore, I have segmented the employees into 5 percentage groups. 0 - 20%, 20-40%…
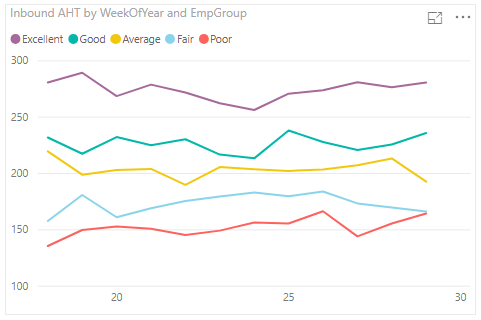
Now that I have all the employees into the 5 segments, I need to create an average per segment so I can display the 5 different averages on a line graph over time.
I need to create a calculation that will recognize the segments in the legend.
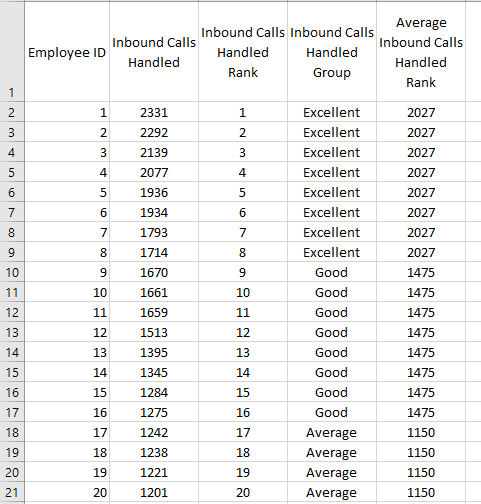
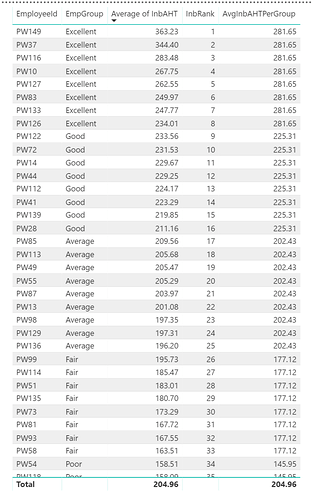
I am looking to achieve the figures shown in the final column.
Thanks in advance for any help.
Measures i currently have:
Inbound Calls Handled Group =
VAR TotalCustomers = CALCULATE( COUNTROWS( Employees ), FILTER( ALL( Employees[EmployeeId] ), [Inbound Calls Handled] > 0 ))
VAR EmployeeRank = [Inbound Calls Handled Rank]

RETURN
IF( ISBLANK( [Inbound Calls Handled]), BLANK(),
    CALCULATE( SELECTEDVALUE( 'Employee Groups'[Group] ),
        FILTER( 'Employee Groups',
            EmployeeRank > TotalCustomers * 'Employee Groups'[Min]
            && EmployeeRank <= TotalCustomers * 'Employee Groups'[Max] ) ) )

Inbound Calls Handled Rank =
IF( ISBLANK( [Inbound Calls Handled]), BLANK() ,
    RANKX(
        FILTER( ALLSELECTED( Employees ), NOT( ISBLANK( [Inbound Calls Handled] ) ) ) ,
            [Inbound Calls Handled], , DESC ) )
Nick_M
July 23, 2019, 12:30pm
3
@connortapp
Can you upload some of that sample data or even better the pbix file?
Thanks,
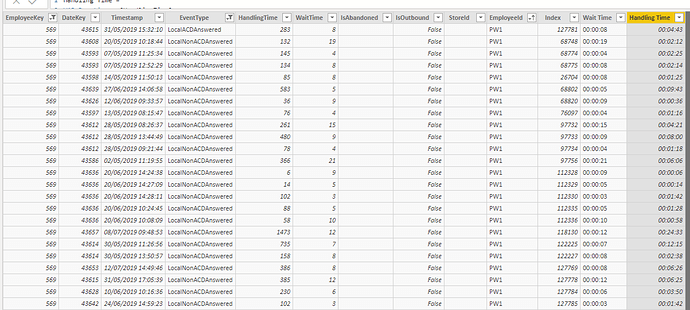
This is the main table i am working with:
This is the parameters i have created:
Does this help?
I have employee data in pbix file so if needed i will need to clear that out.
Nick_M
July 23, 2019, 4:15pm
5
It would be ideal if there was some data I could work with, even if it is dummy data.
Thanks,
BrianJ
July 23, 2019, 10:33pm
6
@connortapp ,
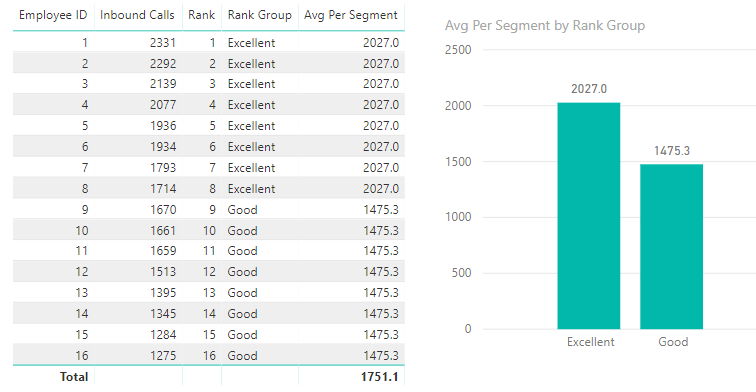
I think this gets you what you’re looking for:
Avg Per Segment =
CALCULATE (
    AVERAGE( CallData[Inbound Calls] ),
    ALLEXCEPT( CallData, CallData[Rank Group] )
    )
Check out this tutorial here.
This shows you want you need to do to get these into %.
A lot depends on the context of the calculation, but you’re 90% of the way there.
https://blog.enterprisedna.co/2017/10/31/advanced-segmentation-example-using-dax-in-power-bi/
The % bit to this tutorial is at the end.
I also recently answered a similar forum post around this as well.
See below.
This is an interesting one, but not too difficult.
I looks like you have the first part where you need a supporting table here with your groups.
I’ll work with an example from the online portal here.
I’m presuming you’re using the dynamic grouping formula pattern for this.
Something like the below.
Profits by Custom Grouping =
VAR RankingDimension = VALUES( Customers[Customer Names] )
RETURN
CALCULATE( [Total Profits],
FILTER( RankingDimension,
COUNTROWS(
FILTER(…
Thanks
Hi All,
Thanks for getting back to me on this thread.
I still haven’t been able to achieve what i am after.
@Nick_M I have created a sample pbix file.
@BrianJ that didn’t work im afraid. Thanks anyway.
I have watched the videos and still struggling to make sense of how i would tackle this.
Sample Data - CSA Performance.pbix (2.0 MB)
BrianJ
July 27, 2019, 7:39pm
9
@connortapp
I took another shot at this, and may have cracked it. Possible solution file posted below. See what you think.
Hope this is helpful.
Sample Data - CSA Performance - Solution Attempt.pbix (2.1 MB)
