Customer ABC analysis

Hey Everyone,

I need to do a Daily customer analysis (ABC clustering) that is bound to the following parameters.
The parameters are measured against the limits of every customer’s average sales over a year.

Group Sort Low High
A+ 1 3.286 999999
A 2 978 3.285
B 3 497 977
C 4 250 496
C- 5 0 249

In the analysis, sales are then to take place in the total cluster. For Example, how much sales did all the customers in the A+ category make in total? Like this:

Group Total Sales % Share Total Sales LY % Share LY
A+ 1.742.861 67,80% 1.767.399 66,80%
A 496.128 19,30% 515.130 20,30%
B 222.209 8,60% 226.146 6,60%
C 86.408 3,40% 83.360 5,40%
C- 23.048 0,90% 15.921 0,90%

Here’s my data model. I have a sales table and a customer table.


Do you have a solution here?

I’ve tried a lot of your segmentation videos here but I don’t get it displayed correctly.

This is an interesting one, but not too difficult.

I looks like you have the first part where you need a supporting table here with your groups.

I’ll work with an example from the online portal here.

I’m presuming you’re using the dynamic grouping formula pattern for this.

Something like the below.

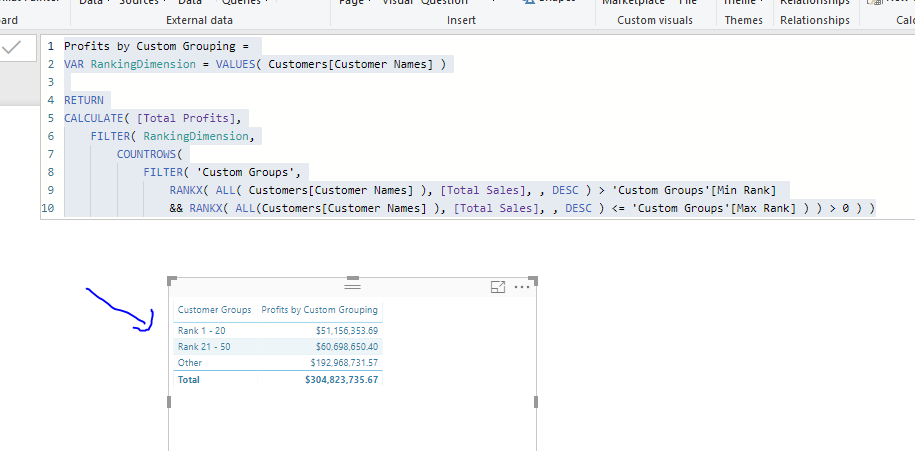
Profits by Custom Grouping = 
VAR RankingDimension = VALUES( Customers[Customer Names] )

RETURN
CALCULATE( [Total Profits],
    FILTER( RankingDimension,
        COUNTROWS(
            FILTER( 'Custom Groups',
                RANKX( ALL( Customers[Customer Names] ), [Total Sales], , DESC ) > 'Custom Groups'[Min Rank] 
                && RANKX( ALL(Customers[Customer Names] ), [Total Sales], , DESC ) <= 'Custom Groups'[Max Rank] ) ) > 0 ) )

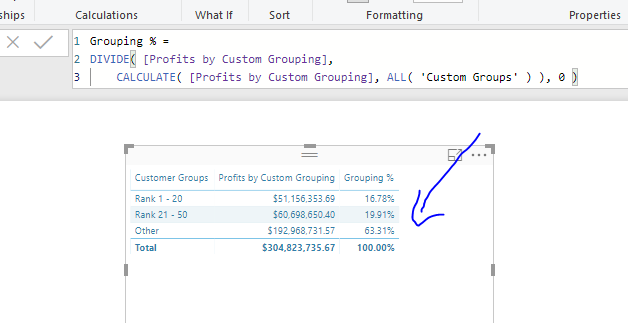
To then get the % share all you need to do is branch out into the below.

Grouping % = 
DIVIDE( [Profits by Custom Grouping],
    CALCULATE( [Profits by Custom Grouping], ALL( 'Custom Groups' ) ), 0 )

image

This should do it.

Check out this tutorial here to learn more about this.

See how you go.

Sam

Hi, I’m afraid the formula isn’t working correctly yet. In my concrete case, the segmentation value for each customer is based on the sales made in one year.

image

Based on this segmentation, the sales within the selected period are to be calculated for the individual groups.

these sales within the groups are not correct

image

I’m not sure about this formula. You shouldn’t need the ALL if this is just working out the sales last year

image

When you say one year, what exactly do you mean with this? And what date context do you have on your report?

Do you mean just one year back from today (or the date selection?)

You have to remember that the Total Sales amount is in one context, then the Customer Sales 1Year is in another because of the filters inside CALCULATE…

When you place this formula below against the say a customer context in a table do you get the right amounts for each customer?

image

Other than this would need to see the example to understand more around everything at play here.

The logic is correct with the formula pattern so I’m unsure really what it could be based on what I can see.

I mean 1 Year back at the selection date. That’s why I use the All function. I’ll try to describe it a little more precisely. The basis for the customer segmentation is the annual turnover of each customer, whereby each customer is assigned to a group. For example customer X makes 800,- turnover in the year, so he is in group B, customer Y makes 1300,- turnover in the year, so he is in group A.

This part of the Formula:

FILTER( RankingDimension;
        COUNTROWS(
            FILTER( 'Customer Group';
                [Customer Sales 1Year] > 'Customer Group'[Low]
                && [Customer Sales 1Year]<= 'Customer Group'[High] ) ) > 0 )

Now the turnover is to be represented in the selected period of the groups. For example Which sales did the groups make in the period with the assigned customers?

This part of the Formula:
CALCULATE( [Total Sales];

I hope my result, what I want is now something more understandable.

The thing about the DATESINPERIOD function is that it already removes the context within the function itself, so you shouldn’t need the ALL function. You should get the same result without it.

Regarding your scenario,

What I would check first…is the Customer Sales 1Year measure actually working out the answer that you want when you place it against a customer context, say in a table in a report.

If you’re not getting the right segmentation I’m relatively confident this is probably not calculating the correct answer.

I can’t tell by any information you’ve provided if you’ve actually done this or your maybe just assuming it’s working out the correct number.

I feel if you work this part out, you’ll solve this.

Past this I would recommend setting up a demo model for further testing if need be.

Thanks
Sam

First I removed the ALL function. And I found out why I don’t get the correct values, but I have no explanation for it. I have checked the turnover of a year with the grouped turnover of each individual customer. In the grouped sales calculation, some customers have no values even though they have values in the annual sales.

The Total Sales calculation in the formula is a simple sum function
Total Sales = SUM('Customer Sales'[Total Sales])

What do you think about that?

Would have to see the model or an example to help further. You can add it here in the forum post.

Too difficult to understand everything else at play here.

Thanks
Sam