Hey Everyone!
New to using Powerbi and the forum!
Can you please help to understand how to structure my table with hierarchy levels, as illustrated in the picture provided.
Cheers Adam
Hey Everyone!
New to using Powerbi and the forum!
Can you please help to understand how to structure my table with hierarchy levels, as illustrated in the picture provided.
Cheers Adam
Welcome to the forum!
Take a look at this course - comprehensively covers financial reporting including the data model setup, template development, DAX calculations, etc. Should be a great place to start for your project.
For a general roadmap on getting up to speed on Power BI, I recommend taking a look at this thread:
Adam,
Is this picture from Excel or Power BI? Power BI does not have the same functionality as Excel, but something like this should be doable. It also helps when posting questions in the forum if you post a sample PBIX file.
Thanks
![]()
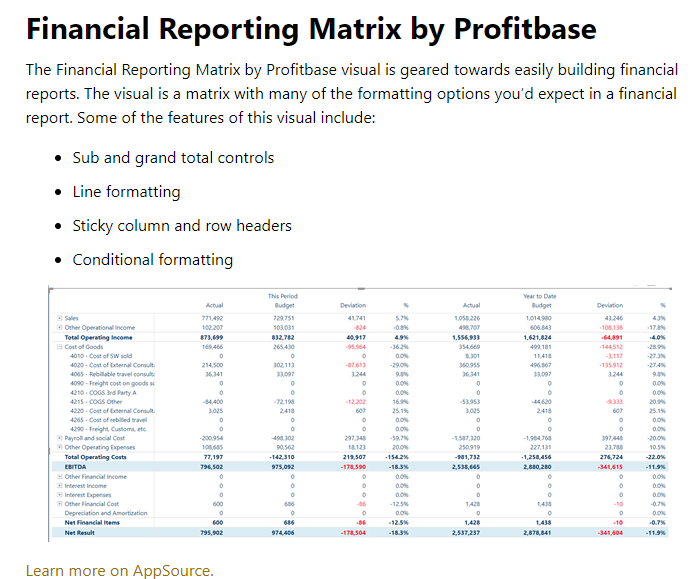
This snap shot was taken from constructionbi.com
So I’m assumming it was created with Powerbi.
If you have any other guidance that would be appreciated.
Adam
Adam,
The picture shown was using the Matrix visual. One tip is in the format painter section make sure that Stepped layout is turned off. Sam has shown this in some of his material as well, mainly when he went over how to setup financials. Best tip I can give you is to get something started on your end, and when you run into an issue post the sample PBIX file in the forum so that we can assist.
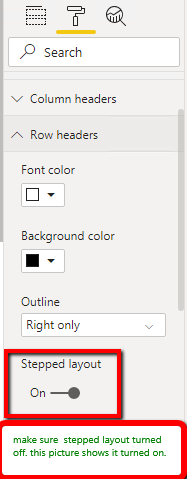
Thanks
![]()
saw this in the november update. Havent looked at it yet, but looks like it be beneficial
Thanks Nick 
Interesting. Looks to have some ok functionality. Video they produced is hopeless though. Can hardly see what they are showing.
you are the best, that’s exactly what I was looking for. Thank you so much!!! So easy!