Get attribute related between two dimension tables

EDIT – added model diagram

Hi all, newbie post here. I have searched all over for this but not sure I am asking the right question and all hits are usually not quite what I want. I am certain this is not new!

I have a fact table TIMESHEET, dimension STAFF, and JOB. Staff is active one-many relation to Timesheet. Job also 1-many to Timesheet. Now, here comes the question.

JOB has a ManagerID (FK to Staff[StaffID]). But I cannot relate Staff to it except in an inactive relationship (which I have done), Staff one to many Job on ManagerID.

So I want to analyse time by Manager and Job with Manager Name or other Manager fields …

Can anyone point me to a pattern that does this? I have looked at lookupvalue related relatedtable treatas all without success and I have read the role playing dimension stuff over and over thinking this is nearly it but isn’t… Help?

Thanks all.

a question like this is going to be best solved if you can posted a simplified model of your report (with all the relationships and current measures you have set up)

Without that resource, my guidance is that if you have successfully created an inactive relationship between the tables, you need to look at USERELATIONSHIP for your measure.

https://forum.enterprisedna.co/t/comparing-treatas-vs-userelationship-in-power-bi/11562/5?u=heather

1 Like

@mattduffyzz,

Welcome to the forum – great to have you here!

It will help to see a diagram, but based on your description what about denormalizing your dimension tables by combining Job and Staff and relating that to Timesheet via a composite key composed of the concatenation of the keys for the Job and Staff tables?

Alternatively, it sounds like you might be able to snowflake Staff to Job to Timesheet, though I strongly prefer keeping my models in a star schema even if it involves denormalizing the dimension tables. Another advantage of denormalization is that it makes syncing of your slicers automatic.

  • Brian

@BrianJ, @Heather – thanks for such rapid replies.

Diagram edited in to original post. The diagram doesn’t show the Operative Name in the Operative table (Operative = Staff, Contract = Job - I changed the language to simplify things for readers).

So if I can find a way to be showing, say, a table view with

  • Operative[OperativeName] (meaning Manager Name herex)
  • Contract[ContractName]
  • Sum(Timesheet[TimeCost])

x - (that is, the manager name, not the Operative who did the work on the Contract but the Manager Operative associated with the Contract[ManagerID] relationship to the Operative table)

If I have a pattern for that then that will explain it to me. I think I am bit stuck in traditional Relational thinking or Excel thinking (hence my use of the word “Get” in subject) and I would VLOOKUP the Manager’s name from the Operatives worksheet for example, or JOIN [Contract] TO [Operative] ON [ManagerID]=[OperativeID].

Your help is greatly appreciated. Thanks very much!

DIAGRAM HERE FOR CONVENIENCE:

@mattduffyzz,

For problems beyond a certain complexity, I have difficulty solving them on paper - need to get my hands dirty in the actual data and the model, and this one has crossed that threshold for me.

I’m assuming that given the nature of the data, that you can’t just post the current PBIX file. However, here’s a video I put together on some simple ways to full mask confidential data to allow for posting on the forum.

Would you be able to post a masked version so that @Heather and/or I can dig in on the details and test our proposed solutions?

Thanks!

  • Brian

@BrianJ, it is all made up test data I’m using for learning however this data structure is pretty common in my experience.

I will look at the video pare down the volume a bit and see how I am supposed to get it to you.

Thank you so much for your help, it really is kind!

@mattduffyzz,

To post a file, when you reply you can either use the up arrow icon on the toolbar:

or do what I typically do - just drag and drop. Also be sure to include the base data file in addition to the PBIX so that we can do some restructuring in Power Query if needed.

Thanks.

  • Brian

@BrianJ, @Heather

Here’s the PBIX and XLSX files - I slimmed them right down, and made a couple of comments in both.

Any questions please ask. I have put a table in and added Manager ID to it … I just want to understand how I get Manager Name (from the Operative table) in there. This is going to be a recurring pattern for me I think, so the solution to this might be a watershed moment for me :smiley: JobStaffCostData.xlsx (183.3 KB) JobStaffCostExample.pbix (1.2 MB)

@mattduffyzz,

I did a major overhaul of your data model that transformed it into a simple star schema model by combining tables with like elements. I also did a series of transformations that allowed bringing the manager name over into the Operatives table, solving your issues with Manager Name now with just drag and drop.

I’m not saying this is perfect, since I don’t know your specific business use cases well enough to know all the other questions you’ll want to answer ,and thus whether this revised model optimally supports those analyses. But this should at least give you some good food for thought about how to restructure your model to best suit your needs.

Here are the basic transformation steps I took:

  1. duplicated operatives
  2. removed all columns except for operative ID and name, renamed table to staff list
  3. merged team with staff list to get manager name
  4. merged operative with team to get team information
  5. merged contract and customer
  6. deleted relationship between contract and contract budget (granularity mismatch - will need to be handled differently)

If you haven’t already, I strongly recommend you take this course, which goes through all of the concepts I utilized above:

Also, this is a great supporting article on the importance of star schema for Power BI:

I hope this is helpful. My PBI file attached below.

2 Likes

@BrianJ , once again thank you for the support and time you’ve put in to this - you’ve made my first Enterprise DNA experience top notch, and I hope in future to be able to “give back” in a similar manner!

I’ll put my question here and the rest of my notes below which you can probably ignore :slight_smile:

I am familiar with Snowflake and Star schema, but I always thought they were effectively the same and star points would have further relations.

Question: When we refer to “The Importance of Star Schemas in Power BI” are we actually saying “Try to avoid Snowflake models if you need to analyse core facts by those outlying dimension columns or if there are joins between dimension tables required”?


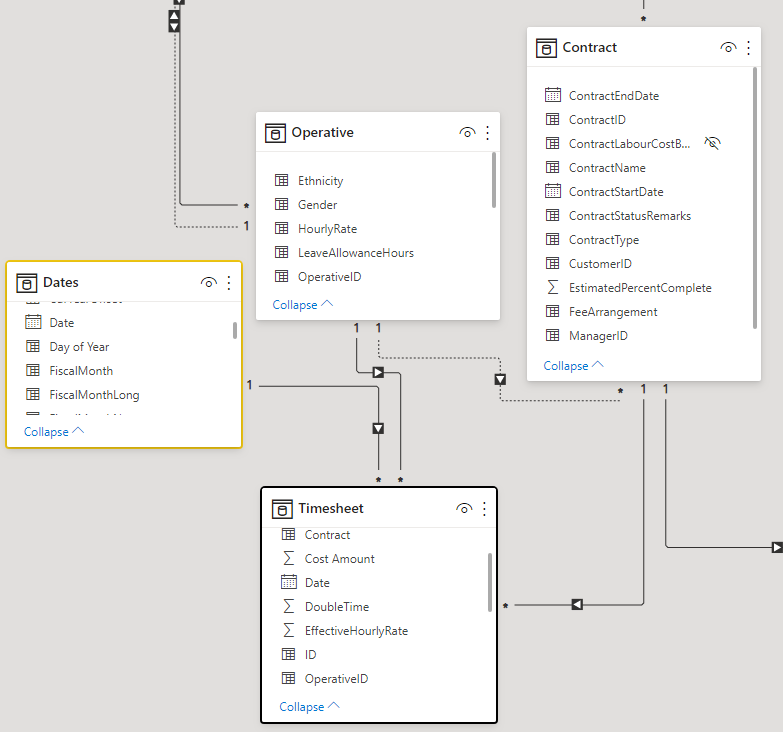
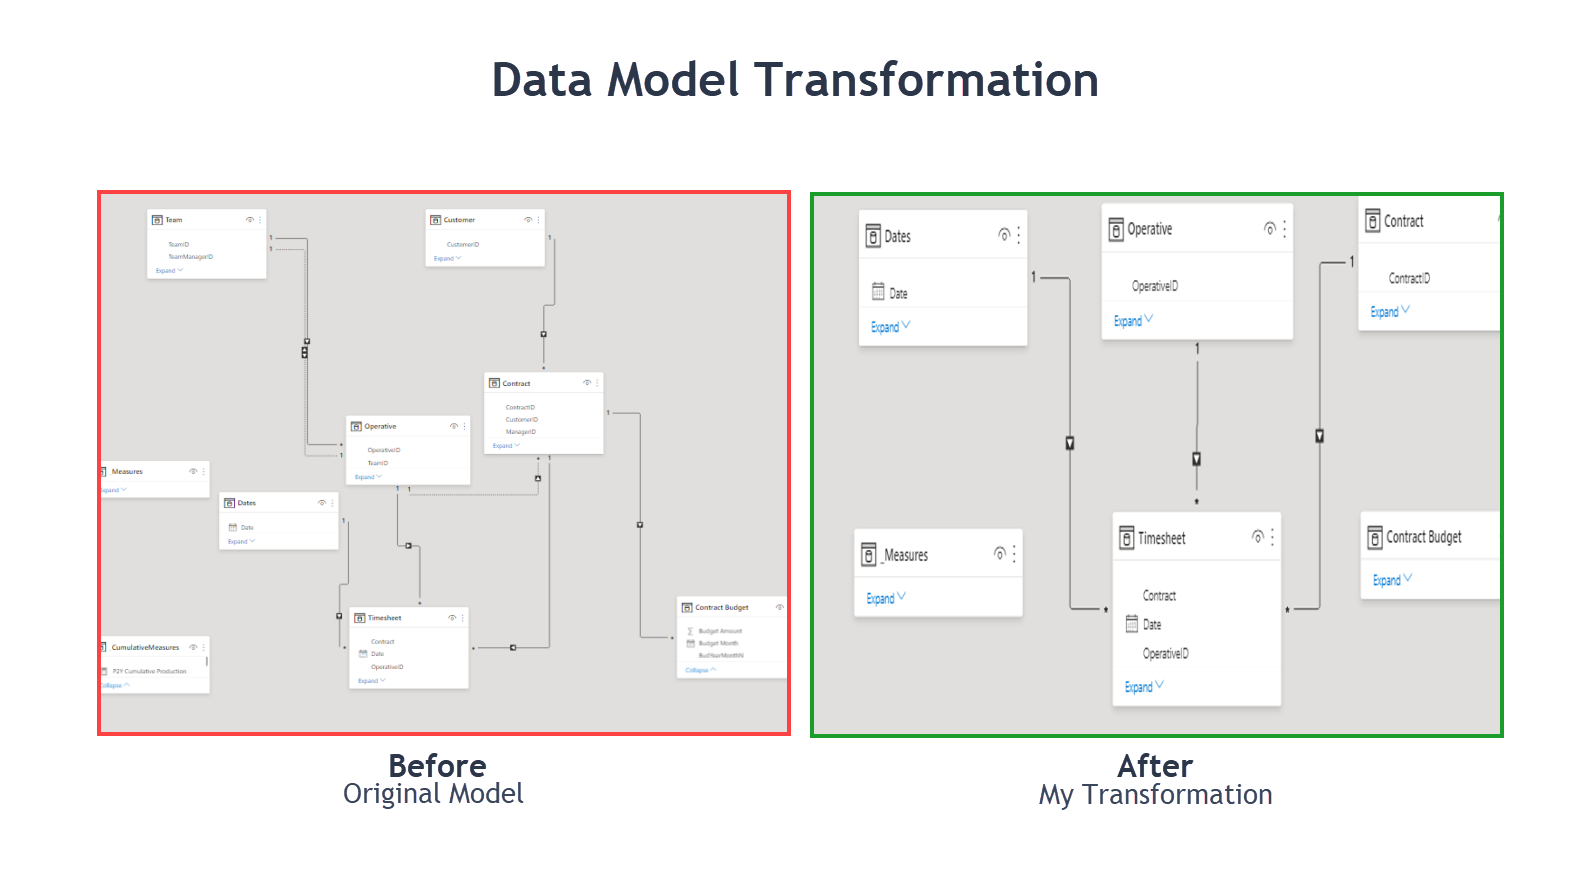
The work you’ve done on the model is what in my old RDBMS-brain I call de-normalisation and I am absolutely comfortable with that - of course when data volumes or dynamics change then other challenges may need to be overcome.

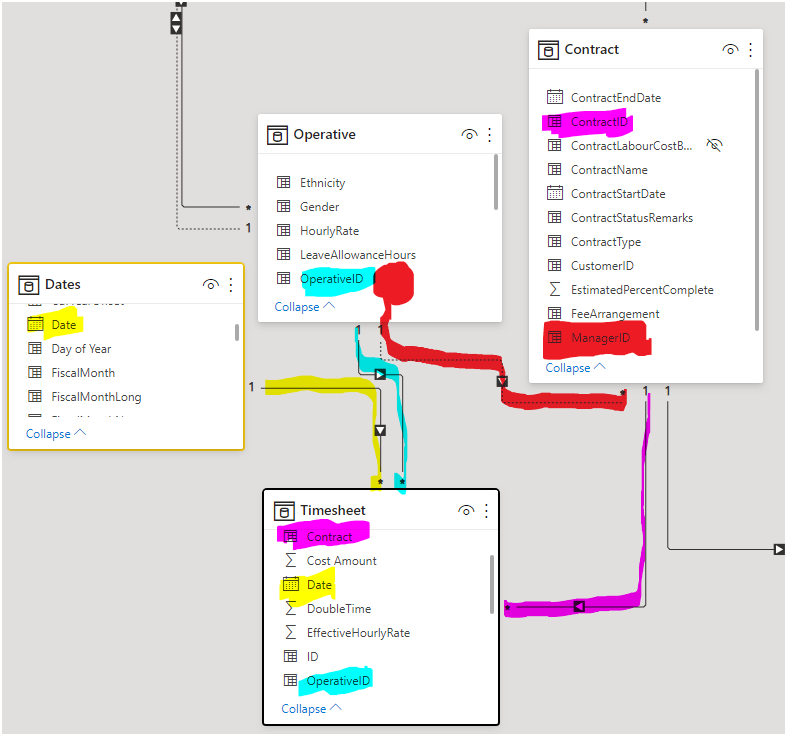
Regarding the re-shaping you’ve done, it’s not quite right but it has given me the answer (Team Manager is not the same as Contract Manager, so I want to see how the Contract Manager (who might also be a Team Manager and an Operative on a job) is performing in managing Contracts under their stewardship).

So, I think I just need to bring the pertinent Operative details for the Manager that I wish to analyse Contracts by over to the Contract table (e.g. set up Contract[Manager Name]) through the data transformation process.

I am familiar with Snowflake and Star schema, but I always thought they were effectively the same and star points would, in my world, almost always have further relations.

Question: When we refer to “The Importance of Star Schemas in Power BI” are we actually saying “Try to avoid Snowflake models if you need to analyse core facts by those outlying dimension columns or if there are joins between dimension tables required”?

Again, thank you very much for your help - I will work through the transformations you’ve done and move forward in that direction.

Matt

I think that’s a fair statement, though I would just simplify it by saying “try to avoid snowflake models if possible”, with the operative word being “try”. In general, with a plain-vanilla star schema (single level dimension tables with a one-to-many relationship to the fact table(s)), your DAX will be easier to write, validate, debug and understand, and the performance of your report will be better. That being said, Power BI can definitely handle a properly constructed snowflake schema, and there are times when that will be the best structure for a particular use case. But I’ve heard Marco Russo lecture on this topic, and he estimates that 95%+ of reports can be handled best with a star schema.

Here’s a thread on this topic that is worth reading through, as Enterprise DNA experts @Heather and @Nick_M each raise some interesting points that I think you’ll find very relevant.

I’ve really enjoyed working with you on this one, and glad to hear you’ve had a good first experience on the forum. It is a wonderful community.

– Brian