General Ledger Grouping

Hi Sam

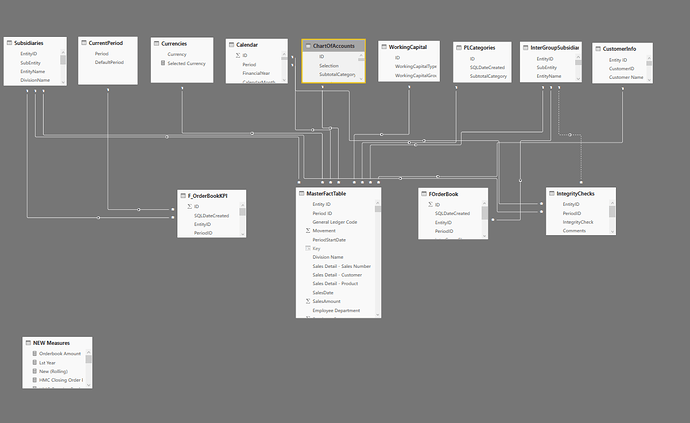
Thanks for responding so quickly. I have attached an image of the data model. Essentially, I have a very much all I need in the MasterFact Table…its probable not ideal but it seems to work OK,

Data modelData model.png876x666 59.2 KB

Advanced Editor of the MasterFact table is as follows:
let
Source = Sql.Database(“srv-sql01\pwc”, “PT_Group_Consol”, [CreateNavigationProperties=false]),
dbo_V_BI_MasterFact = Source{[Schema=“dbo”,Item=“V_BI_MasterFact”]}[Data],
#“Renamed Columns” = Table.RenameColumns(dbo_V_BI_MasterFact,{{“PLSubtotalCategory”, “PLSubtotalCategoryID”}, {“DivisionCode”, “DivisionCode”}, {“AgedCreditor”, “Aged Creditor”}}),
#“Changed Type with Locale” = Table.TransformColumnTypes(#“Renamed Columns”, {{“PeriodStartDate”, type datetime}}, “en-GB”),
#“Changed Type with Locale1” = Table.TransformColumnTypes(#“Changed Type with Locale”, {{“FinancialDate”, type datetime}}, “en-GB”),
#“Renamed Columns1” = Table.RenameColumns(#“Changed Type with Locale1”,{{“WorkingCapitalYTD”, “WorkingCapital”}, {“AgeBracket”, “Aged Debtor/Creditor Age Bracket”}, {“OrderBookType”, “Order Book Type”}, {“Year”, “Financia lYear”}, {“SalesProduct”, “Sales Detail - Product”}, {“SalesCustomer”, “Sales Detail - Customer”}, {“SalesProductCategory”, “Sales Detail - Product Category”}, {“SalesLedgerAdjType”, “Sales Ledger Adj Type”}, {“SalesNumber”, “Sales Detail - Sales Number”}, {“ScenarioDescription”, “Scenario Description”}, {“StockType”, “Stock Type”}, {“WorkingCapitalDays”, “Working Capital Days”}, {“OrderBookKPIType”, “Order Book KPI Type”}, {“OrderBookKPIAmount”, “Order Book KPI Amount”}, {“OrderBookInterGroupFlag”, “Order Book Inter Group Flag”}, {“InterGroupBalanceType”, “Inter Group Balance Type”}, {“InterGroupID”, “Inter Group Subsid ID”}, {“QuotationCount”, “Quotation Count”}, {“QuotationComments”, “Quotation Comments”}, {“QuotationAmount”, “Quotation Amount”}, {“PeriodID”, “Period ID”}, {“ForexBalanceType”, “Forex Balance Type”}, {“ForexCurrency”, “Forex Currency”}, {“GeneralLedgerCode”, “General Ledger Code”}, {“FOBRevenuePeriod”, “FOB Revenue Period”}, {“EntityName”, “Entity Name”}, {“EntityID”, “Entity ID”}, {“EmployeeDepartment”, “Employee Department”}, {“DivisionName”, “Division Name”}, {“DivisionCode”, “Division Code”}, {“CreditTerms”, “Credit Terms”}, {“AgedDebtor”, “Aged Debtor”}, {“AgedDebtorComments”, “Aged Debtor Comments”}, {“AgedCreditorComments”, “Aged Creditor Comments”}})
in
#“Renamed Columns1”

The Budget is based on Called “comparative” and is in the model. I have sent you the PBI separately via email - this will make more sense.

Thank you as always for your prompt responses. I will also take a look at the course information suggested.

Hope to hear from you. Thanks Sam.
What you need is a bridging table to group your accounts.

This then hooks into a consolidated reporting key as described in the BI Accountant article. Did you review this information?

I cant see any way Power BI can produce the exact information as shown in your matrix visual without a fair bit of mucking around to be honest. If anyone has a good way to do this i would be most interested! :smile:

Hi Gary - thanks for helping, I’ll take a look at Bridging Tables and the BI Accountant article.

OK Horace, I’ve done some work in the model (but I can only go so far as to advise here rather than complete much more).

Firstly developing an intuitive data model is absolutely essential here. In my personal view the way you had it structured (or the look of it) would always be very difficult to visualize in your mind what is actually happening with filters in your reports.

I’ve re-work it to the below and hopefully you can see the immediate difference in terms of understanding what’s going on.

This might not be exactly how it ends up but it’s a great base to build from.

You now can visual the filters all flowing down like a waterfall. I go through this technique is the advanced modeling course in more depth - http://portal.enterprisedna.co/p/advanced-data-transformation-and-modeling

Also naming conventions are important here also. I mention this in many videos, but highly recommend intuitively naming everything in your models - https://www.youtube.com/watch?v=dBSiClTGYKo

Also I would look to clean up your tables, for example delete some unrequired columns in the master fact table, again to simplify things (I’m big on this) - https://www.youtube.com/watch?v=Q48pyYLAPcc

It does look like you’ve got a lot of your measures correct, which is great. I would suggest just getting into some good habits around formatting. Trust me, this helps a lot. Formulas like this are beasically impossible to audit. - http://portal.enterprisedna.co/courses/ultimate-beginners-guide-to-dax/lectures/2989700

Potentially also arrange your measures that are currently sitting inside the masterfactable. When you have 30 -100 measure all stacked like that I can become quite confusing to easily find and work with the correct calcs.

Measure table are certainly the way to go here for this - I detail this a bit more in a recent video here - https://www.youtube.com/watch?v=diE7Z0doWZw

Let’s start with these, as I like to look at model development like building a house. If the foundations aren’t correct you’ll be compensating everywhere and then ultimately not getting a great results at the end of it.

Chrs
Sam

Hi Sam- thank you so much for a very detailed response. I certainly have a lot to take a look at, consider and change in terms of the datamodel and tidying up the Measures that I have created etc. Agreeably, I need to place all the measures in a separate table.

I’ll take a look at this first before trying to bring about about any further solutions regarding bridging tables etc.

Overall this is really good advice which I plan to now put into practice and from everyone. Thank you again Sam.

Regards

Horace.

Horace,

I recently read a new blog post on the powerpivotpro website that might be of interest in your quest to build an income statement in power bi.

Cheers,
Mack

Hi Mack

This is as a really good link. Loads to look at here as viable workarounds and useful tips to get the Accounting formats I need. Thanks.

Hi Mack

I have a scenario where the Fiscal year starts 01/10/2017. I need to show the Accounting “Period” as 201801 (for October), 201802 (for November) and 201803 (for December) … and so on.

I have tried a few things but unable to get this to work as a Dax Column/Measure.

Do you have any suggestions please?

Hey Horace,

this link should help you.

https://blog.andredevelopment.com/post/power-bi-desktop-calendar-with-fiscal-information

Nice resource. Like it.

I also detail a way to do this in this video (but some of the logic in the above link is likely simpler)

1 Like

Thanks Mack - very useful.

Hi Mack.
I am trying to format most of the results ( visualisation screen) to the nearest £,000. I have added this in to my measure below. However, when I drill into the numbers I get “blank rows which I don’t want to see.

Is there another way to to get the number I need?

P&L Movement Primary £000 = format(CALCULATE([PLMovement],
FILTER(MasterFactTable, MasterFactTable[Scenario Description]
= ‘Scenarios (Primary)’[PrimaryScenario])),"#,###,;(#,###,)")”

I have tried applying the format to the calculated results in different ways seem to still have the same issue.

Should I be trying to format the whole Column in the table so that the format is there without the need for applying a “Format” in the Measure?

Hi Sam - hope you are well.

I’ve just posted a question to Mack - not sure if you can advise on the best path to take?

Regards

Horace

Can you use 0,000 instead of that

Also possible to add image of what the results are based on the context of the calc.

You should definitely do all formatting in columns though before you do anything like this. You can also format all your measures as well. Do you know how to do this?

Hi Sam

I don’t know how to format all the Measures so that the numbers in the visualisation appear as per the format I need. Could you suggest how this is done please?

Hi Sam

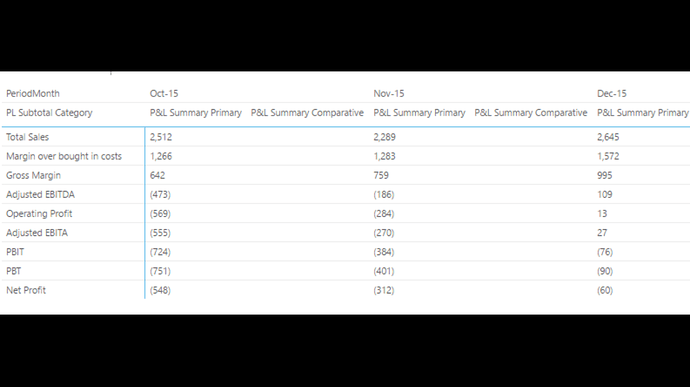
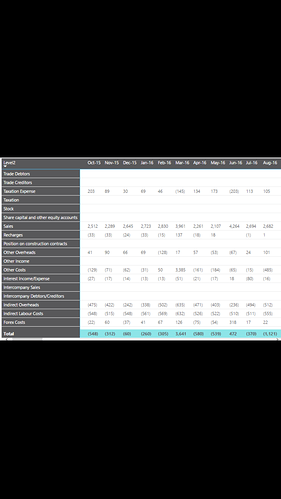
Please see image below and the issue that I am having.

As you can see, the FORMAT function appears to work on a table where I am not drilling up or down. However, where I do need to drill up or down, the result leave blank rows which I do not want to see.

The first image is of a table – with no drill in.

The second image is another table where drill up/down functionality is required.

The DAX code that I am using to get the results from the second image is as follows:

P&L Movement Primary £000 =
format( CALCULATE(MasterFactTable[PLMovement],
FILTER(MasterFactTable, MasterFactTable[Scenario Description] = ‘Scenarios (Primary)’[PrimaryScenario])) ,"#,###,;(#,###,)")

If there is a way to get rid of the unwonted rows then that would be great !!

This is quite easy stuff. You shouldn’t ever need to use format formulas in measures.

All this work is done for you with some simple formatting early on.

Here’s some examples to go through in the query editor.

http://portal.enterprisedna.co/courses/103686/lectures/1772341

At 10:30 in this video I show you how to format measures

Hi Sam
Having watched both videos I still cannot see how to get the format I need.

I know that by using FORMAT it changes the values to TEXT and this is now good when I want to chart the same data.

If I go to the ‘Modeling Tab’ and change the Currency Format to $ English (United States) the Minus Values in the table now have brackets around them…HOWEVER, each value starts with the $ symbol…this repetition in the table is not needed. Is there a way to remove these $ symbols?

I have also spent some time looking on the internet (a far amount actually) and some Power BI Users have raised similar issues…

Hope you can help.