General Ledger Grouping

Hi all

I am trying to group some General Ledger descriptions so that I can show this in a table where I have subsidiary company’s shown on ROWS and each accounting element shown on in the Columns section.

                                                       Subsidiary 1	Subsidiary 2	....Etc...>>>>>>

Margin over bought in costs £
Direct labour
Direct production overheads
Movement in overheads into/(out of) WIP
Gross Margin

Happy to send an image through if this would help?

Hi Horace, Yes if you can send some images through of exactly what you require here, as I don’t believe it’s that difficult but I just not exactly sure the result you need.

You may be able to use the matrix visual, or may need to create a few simple measures.

I’ve quickly worked on it and received results like the below. Is this what you were after?

Chrs

So what I completed here is not too difficult as I just created a measure and then used the matrix visual. The harder thing to work into this analysis is the roll up to ‘gross sales’ for example and others.
Also I presume you may want to sort the ledger items as well?

You can create a hierarchy that will allow you to jump between the two ‘levels’ in the data

image

See image for what I mean here.

Let me know if any other questions, and let’s work through it here. Chrs

Hi Sam - this is a huge help.

In terms of Hierarchy how would this work?

If I want to calculate: “Margin over bought in Costs”… this is made up of the following Parent and Child values added together:-1:
External sales - Level 3 (Child)
Intercompany sales - Level 3 (Child) - these both = Total Sales
Direct Variable Costs - Level 2
The grand total would then = Margin over bought in Costs

If I could get an example of how to do one of the calculations then I could work through the rest. Would it be better to create a table and add these Parent and Child columns in and then create some logic to do one of the calculations ? I’ll take a look again at hierarchy but I’m not sure it will give me what I need at first glance. Happy for other suggestions…

Regards

Ok your on the right track here. What you will have to do is create separate measures like you have and then branch those out by adding them together to get the rolled up number. ie Gross Margin.

Regarding the rows/columns, shouldn’t be too difficult from there. As you just need to change the axis for that particular dimension.

image

To replicate that exact table is not really possible right now with the current visualization available in Power BI unfortunately. It doesn’t allow rollup totals just yet.

Would it be possible to place each individual section of the ledger into separate tables?

One other thing you might need to solve is the order of the items. At the moment they are just alphabetical right? To do that you’ll need to create a new table that summarizes the each individual item in the ledger then placing an index number next to each item. I’d recommend doing this manually in a table in excel so you can update it easily if new items come up.

You can then use that index number as a sorting column in the table area.

image

Let me know if this is helping. Chrs

Producing financial statements in Power BI is not easy as yet but a few people have work a round solutions.

As Sam suggested its the rolling up of the subtotals and grand totals which is a deficiency in the matrix visual…hopefully MS improve this functionality soon.

I found the bi accountant version useful from Imke Feldmann

Good Luck! Its a tough problem your looking at!

Thanks Garry, yes great resource.

I’ll be working on some videos in the near future on these topics as I know there’s a big requirement out there. Chrs

Its true Sam, this is one of the biggest questions people ask me when they want to ditch the accounting system reports and go Power BI for all reporting…

I have to step customers back and tell them that configuring the totals is not a straight forward process.

It really depends on how people want to see the information as well.

I am finding people often think Power BI is a full blown accounting system! I tell them its not really a financial reporting system but more of a visual display system.

Hi Sam, Gary
A huge thanks for your comments and suggestions- this is indeed helping.
I’ll put some of your ‘things to try’ in place and let you know how I get on.

Thanks again.

Great, sounds good. Good luck

Hello,

Check out the following video https://www.youtube.com/watch?v=ojHZkWkEY7Q&t=674s that covers the subject at hand. The video also contains a helpful example file at http://bit.ly/S2SPPIS .
Cheers,
Mack

Hi Gary I wonder if you can help me.

I have a set of separate Measure based on data in my MasterFact Table…Example: Sales, Gross Margin, Gross Sales, EBITDA, and Operating Profit.

I need to create a table which shows the Actual and Budget (current month) in two columns and then 2 more columns which show the YTD Actual and Budget.

I have tried to use the summarise formula but I’ve not managed to get this to work. Can you please help? I just need a quick step guide on how to solve getting the result I need. Thanks in advance

image

Hi Sam I wonder if you can help me.

I have a set of separate Measure based on data in my MasterFact Table…Example: Sales, Gross Margin, Gross Sales, EBITDA, and Operating Profit.

I need to create a table which shows the Actual and Budget (current month) in two columns and then 2 more columns which show the YTD Actual and Budget.

I have tried to use the summarise formula but I’ve not managed to get this to work. Can you please help? I just need a quick step guide on how to solve getting the result I need. Thanks in advance

image

Hi Horace, I wish i had one…but its not straight forward doing financial statements in Power BI. You will find a few road blocks along the way and it depends how you have setup your data model.

Can you post image of your accounts table structure and data model. This may improve your chances of finding a partial solution to your issue.

Hi Gary

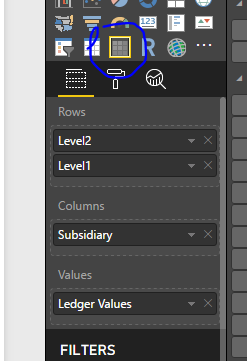
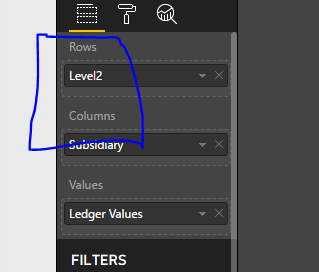
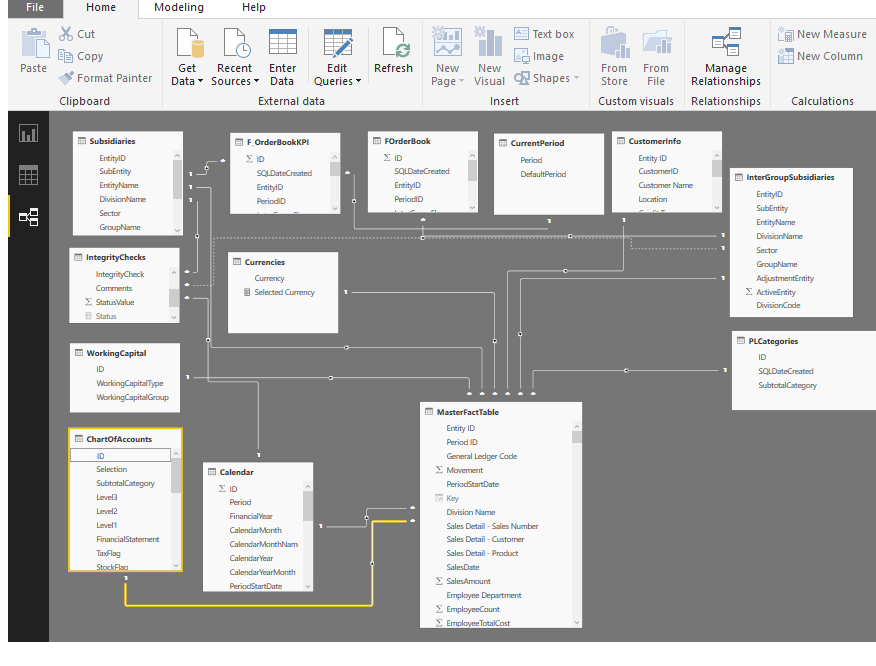
Thanks for responding so quickly. I have attached an image of the data model. Essentially, I have a very much all I need in the MasterFact Table…its probable not ideal but it seems to work OK,

Advanced Editor of the MasterFact table is as follows:
let
Source = Sql.Database(“srv-sql01\pwc”, “PT_Group_Consol”, [CreateNavigationProperties=false]),
dbo_V_BI_MasterFact = Source{[Schema=“dbo”,Item=“V_BI_MasterFact”]}[Data],
#“Renamed Columns” = Table.RenameColumns(dbo_V_BI_MasterFact,{{“PLSubtotalCategory”, “PLSubtotalCategoryID”}, {“DivisionCode”, “DivisionCode”}, {“AgedCreditor”, “Aged Creditor”}}),
#“Changed Type with Locale” = Table.TransformColumnTypes(#“Renamed Columns”, {{“PeriodStartDate”, type datetime}}, “en-GB”),
#“Changed Type with Locale1” = Table.TransformColumnTypes(#“Changed Type with Locale”, {{“FinancialDate”, type datetime}}, “en-GB”),
#“Renamed Columns1” = Table.RenameColumns(#“Changed Type with Locale1”,{{“WorkingCapitalYTD”, “WorkingCapital”}, {“AgeBracket”, “Aged Debtor/Creditor Age Bracket”}, {“OrderBookType”, “Order Book Type”}, {“Year”, “Financia lYear”}, {“SalesProduct”, “Sales Detail - Product”}, {“SalesCustomer”, “Sales Detail - Customer”}, {“SalesProductCategory”, “Sales Detail - Product Category”}, {“SalesLedgerAdjType”, “Sales Ledger Adj Type”}, {“SalesNumber”, “Sales Detail - Sales Number”}, {“ScenarioDescription”, “Scenario Description”}, {“StockType”, “Stock Type”}, {“WorkingCapitalDays”, “Working Capital Days”}, {“OrderBookKPIType”, “Order Book KPI Type”}, {“OrderBookKPIAmount”, “Order Book KPI Amount”}, {“OrderBookInterGroupFlag”, “Order Book Inter Group Flag”}, {“InterGroupBalanceType”, “Inter Group Balance Type”}, {“InterGroupID”, “Inter Group Subsid ID”}, {“QuotationCount”, “Quotation Count”}, {“QuotationComments”, “Quotation Comments”}, {“QuotationAmount”, “Quotation Amount”}, {“PeriodID”, “Period ID”}, {“ForexBalanceType”, “Forex Balance Type”}, {“ForexCurrency”, “Forex Currency”}, {“GeneralLedgerCode”, “General Ledger Code”}, {“FOBRevenuePeriod”, “FOB Revenue Period”}, {“EntityName”, “Entity Name”}, {“EntityID”, “Entity ID”}, {“EmployeeDepartment”, “Employee Department”}, {“DivisionName”, “Division Name”}, {“DivisionCode”, “Division Code”}, {“CreditTerms”, “Credit Terms”}, {“AgedDebtor”, “Aged Debtor”}, {“AgedDebtorComments”, “Aged Debtor Comments”}, {“AgedCreditorComments”, “Aged Creditor Comments”}})
in
#“Renamed Columns1”

Thanks for the image.

I can see the format of your data and you would be best to follow the advice of bi accountant from Imke Feldmann based on what you want to achieve.

Having the 6 column matrix in Power BI with this time period config is not easily achievable with the current matrix offering in Power BI.

What does P2 and P2 YTD?

How have you setup your groupings for GL reporting and subtotals?

Another option is you could investigate whether you can achieve this in Excel using this Power Bi data model and Power BI Add on connector for Excel…It’s a work around but there are only a few options currently for complex matrix visuals.

Hi Horace,

Ok, first I’ll need to understand the data a bit more, as what you’re attempting to do…well there’s a bit to this one.

Have you had a chance to review many of the budgeting video and tutorials I’ve create? As they will certainly give you a start of how to think about and plan your model and measures.

Are you able to pass through the model to have a look at?

Where is your budget data in the model?

The model really need to be improved to make this easier for you. Certainly if you have time I would review the Advanced Modeling course at Enterprise DNA Online. I go into all my best practice tips and it will improve the model immensely and will simplify the measures you require as well.

Let me know regarding all these.

Thanks

It would be good to know

  1. The accounting system your FACT table comes from so we can understand the table structures
  2. How the current FACT table has been built.

I like to split out my FACT table so I have one FACT table for ACTUAL and one FACT table for FORECAST/BUDGET.

I found this useful for doing detailed analysis using projects where forecasts/budgets change regularly.

You can then create measures for time periods by following Sam’s video’s especially the time intelligence and measure branching would be useful.

When building fact tables I strip out any dimension data results from your FACTS table on only keep dimension index keys only…

Your MasterFactTable does look rather wide…and Power BI doesnt like wide data models generally…Do you need things like Division Name, Employee count etc

Cheers
Garry

Hi Gary.
The P2 represents “accounting period Month-2”. Basically, the financial years starts 1st October- so P2 is the month of November.

Could you suggest how I set up GL grouping?

In the meantime, I will also explore your suggestion using Excel…