Formula for Budget Vs Actual when Revenues are Positives and Expenses are negatives (In a Matrix)

Hello,

I am trying to do what seems like it should be a simple Budget vs Actual Formula (Better (Worse))but the results are not what I am expecting and I don’t quite understand which part of my logic is throwing things off.

The formula is as follows:

To be entirely honest I have been playing around with the actual - budget formulas until I had a result that I was expecting and don’t fully understand why some lines are working and some are not. I am also admittedly piecing together various parts and pieces I am learning in these webinars.

Revenues work fine, but the individual groupings and the subtotal return the result I am expecting (a positive number for “better” and a negative number for “worse”

image

Expenses work correctly for detailed lines but the signs are reversed on the total as seen above and below screenshots.

And then finally last but not least the grand total is entirely wrong and I suspect its from my if statement picking up the right things for revenues and expenses by my “else” formula must not be right. I have tried several different iterations of formulas moving pluses and minus around but can’t seem to get the result I am expecting.

Not sure if I am over complicating the formula or just not understanding the logic of what is happening in my formula. Any help is greatly appreciated!

@agagnon,

This should be pretty straightforward to correct, but it would make it a lot easier to provide a clear, specific solution if you could please upload your PBIX file and just provide a simple mockup of the correct results you want to see (can be done in Excel, or even as a hand-drawn markup over your screenshot).

Thanks.

– Brian

@BrianJ Thank you for the quick reply. I will prepare a mock up of desired results and upload that and the PBIX file!

1 Like

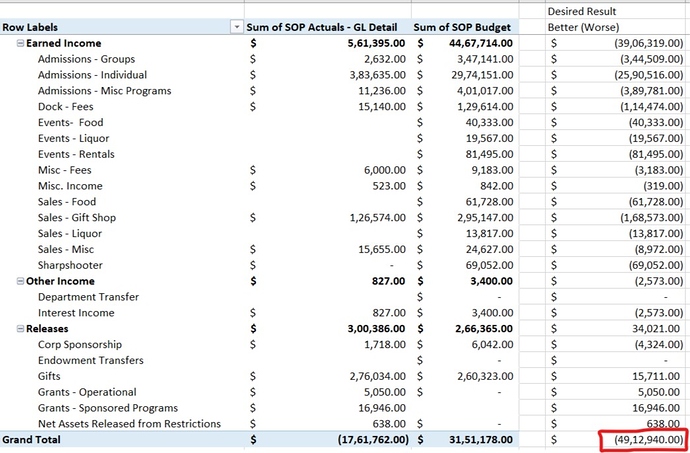
@BrianJ I have attached the PBIX and a pivot table of the same data showing what I want my results to be.

Thank you againDesired Result.xlsx|attachment (29.0 KB) Finance Model - Matrix V2 (Drilling Available).pbix (415.9 KB)Desired Result.xlsx (29.0 KB)

@agagnon,

:+1: - perfect. Expect to have a solution back to you later this evening.

  • Brian

@BrianJ Thank you so much your help is greatly appreciated!

hi @agagnon,

to add my two cents worth is that your expenses are being multiply by -1. if you just have positive number for expenses then it would work. If Actual is more than budget then it should be negative amount (worst), you are over budget.

I"m sure @BrianJ, will provide the solution for you.

That my quick look at the your screen print.

I hope that might help,
Keith

@Keith Thank you for your reply. I tried removing the multiply by -1 from expenses and that did not seem to correct the issue.

Thank you for trying, have a good night!

@BrianJ I had a thought this evening regarding what my next step will be which will be to also have a percentage variance following the same Better (Worse) logic. I’ve done this before in other models so I have an idea of what the formula might look like but if its not too much to ask would you be able to look at that as well?

I expect it would be PDIFF Actual vs Budget = DIVIDE([Dollar Variance Measure],[Budget Measure],0)

My gut says I will have the same problem of seeing unexpected results at the same lines i am seeing them at now.

@agagnon,

Will do - just digging in on your solution right now after completing the autopsy report on my Data Challenge #6 entry. I think once we solve the base problem, the variance measure will be easy to handle the same way.

  • Brian

Although I don’t truly understand how you are trying to get positive values by multiplying by -1, first thing to change in your formula is to not evaluate variables in CALCULATE, and then replace table filter with column filter

Budget Vs Actual - Correct Sign =
VAR Revenue =
    CALCULATE (
        [Actual - GL Detail] + [Budget],
        KEEPFILTERS ( 'Financial Statement Format'[SOP Actuals Category] = "Revenue" )
    ) * -1
VAR Expenses =
    CALCULATE (
        [Actual - GL Detail] - [Budget],
        KEEPFILTERS ( 'Financial Statement Format'[SOP Actuals Category] = "Expense" )
    ) * -1
VAR Result =
    IF (
        SELECTEDVALUE ( 'Financial Statement Format'[SOP Actuals Category] ) = "Revenue",
        Revenue,
        IF (
            SELECTEDVALUE ( 'Financial Statement Format'[SOP Actuals Category] ) = "Expense",
            Expenses,
            [Actual - GL Detail] - [Budget]
        )
    )
RETURN
    Result
1 Like

@agagnon,

@AntrikshSharma beat me to it. Does his revised measure get you everything you need?

  • Brian

@BrianJ @AntrikshSharma Thank you both, this still does not seem to solve the problem. Antriksh, to answer your question I was trying to modify my “actuals” formula shown below to work with the budget. The reason I am doing it this way is because my data is accounting data (debits and credits) from the system. So revenues will generally show as credits which are exported as negative numbers and expenses as debits or positive numbers. In order to to get revenues positive and expenses negative I need to flip the signs in order for the matrix to properly give me a bottom line surplus deficit.

Finance Model - Matrix V2.1 (Drilling Available).pbix (416.0 KB)

@agagnon try this:

Finance Model - Matrix V2.1 (Drilling Available) (1).pbix (418.0 KB)

Better (Worse) Budget vs Actual =
SUMX (
    SUMMARIZE (
        'Financial Statement Format',
        'Financial Statement Format'[Revenue VS Expense],
        'SOP Index'[Financial Statement Grouping]
    ),
    VAR Revenue =
        CALCULATE (
            [Actual - GL Detail] + [Budget],
            'Financial Statement Format'[SOP Actuals Category] = "Revenue"
        )
    VAR Expenses =
        CALCULATE (
            [Actual - GL Detail] - [Budget],
            'Financial Statement Format'[SOP Actuals Category] = "Expense"
        ) * -1
    VAR Result = Revenue + Expenses
    RETURN
        Result
)

@AntrikshSharma This comes closer but still does not match the desired result in the attached. The better(worse) for revenue appear to have the correct numbers but incorrect sign. Currently showing revenues are better when in fact they are worse.

Individual lines for Expenses appear to be correctly showing better (worse) as well as total labor. Individual Non-Labor lines up to recover of overhead appear to be correct and recovery of overhead and the subsequent totals after are incorrect. This leads me to remember recovery of overhead is a revenue account in the general ledger, but grouped with expenses because it is a partial recovery of those expenses. This seems to throw off the non-labor line and the total expense line. Lastly the bottom line deficit is quite far, I have a speculation which I will detail here:

385,557 Expected Non Labor VAR
363,898 - Result for Non Labor VAR

21,659 = Diff

21,659
2 ÷

10,829.5 = Nearly equal to overhead variance of 10,830

191,579 Expected Total Expense Var
169,920 - Result for Total Expense VAR

21,659 = Diff

21,659
2 ÷

10,829.5 = Nearly equal to overhead variance of 10,830

4,912,940 Expected Deficit VAR
4,551,439 - Result for Deficit VAR

361,501 = There are two groupings in “Revenue & Expense” that were filtered out, Investment gain loss and grant expenses

361,501
2 ÷

180,750.5 = If the same logic is true this would be the var

182,072 Grant expenses
1,602 - Investment gain loss

180,470 = Almost the var?

I very much appreciate all of your help with this, makes me feel a little better that maybe I wasn’t missing something obvious. If there is any more info I can provide to help please let me know! This could be a good case study for a future webinar because I suspect this would be a common need from an accounting reporting stand point :slight_smile:

ExcelDesired Result.xlsx (29.0 KB)

Finance Model - Matrix V2.1 (Drilling Available).pbix (416.7 KB)

Summoning Champion @BrianJ

2 Likes

@agagnon, @AntrikshSharma,

Wow, this one has gotten extremely complicated in a hurry. I’m sending up the bat signal to eDNA Expert @Harsh - I think his Chartered Accounting background will be of major help here, since I just saw him expertly unwind a similar problem yesterday.

  • Brian
1 Like

@BrianJ @AntrikshSharma @Harsh

Thank you all again for your efforts here. Since this has gotten quite complex I thought it could be helpful to detail some of my thought process and background in the model.

First - Data Set - I am using a general ledger download giving me all the details you would normally expect to see from journal entries (Debits, Credits, Document numbers, GL Segments). The base “Actual” key measure is driven from a calculated column that says if a row is a debit make the number positive and if it is a credit make it a negative.

Second - Model - From a model standpoint, the goal is to present an income statement using varying levels of detail from as high as revenue vs expense to as low as individual gl details. I thought the best method would be to use a financial statement format file and have the model reference that in all my calculations which I think is evident throughout. So I have a column for revenue vs expense groupings, a column for financial statement grouping, a column for earned vs contributed revenue, and finally a separate column that drives the “SOP Actual” formula seen below. My thought was to use the first column to get the template looking how I wanted, and the second column to drive the calculations.

I hope that base knowledge gives a little context to the dataset an my thought process if that helps at all!

Hello @agagnon,

Thank You for posting your query onto the Forum.

@BrianJ Thank You for providing me this opportunity to solve this query. :slightly_smiling_face:

@agagnon in the Excel file you’ve provided us the desired figure that you’re looking for. Below is the screenshot provided for the reference -

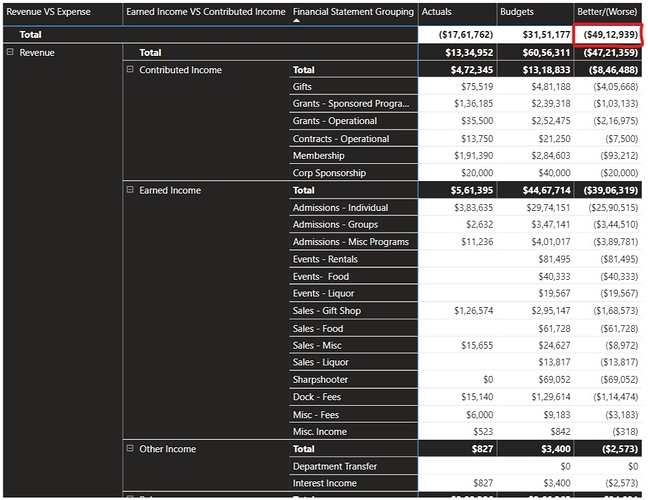
To achieve this, firstly I wrote individual measures and then using the measure branching technique at the end I consolidated those measures and achieved the target figure. Below is the screenshot provided for the reference -

Please Note: Due to decimal round off issue the figure is short by $1/-.

Once I got that figure using the measure branching technique. Then I turned those measures into the single master measure for each of the categories - Actuals, Budgets and Better/(Worse) using the variables. Below are the formulas provided for the reference -

Actuals 2 = 
VAR Revenue = 
CALCULATE([Actual - GL Detail],
    FILTER( 'Financial Statement Format', 
    'Financial Statement Format'[SOP Actuals Category] = "Revenue" ) ) * -1

VAR Expenses = 
CALCULATE([Actual - GL Detail],
    FILTER( 'Financial Statement Format', 
    'Financial Statement Format'[SOP Actuals Category] = "Expense" ) ) * -1

VAR FixedAssets = 
CALCULATE([Actual - GL Detail],
    FILTER( 'Financial Statement Format', 
    'Financial Statement Format'[SOP Actuals Category] = "Fixed Assets Gain/Loss" ) ) * -1

VAR Depreciation = 
CALCULATE([Actual - GL Detail],
    FILTER( 'Financial Statement Format',
    'Financial Statement Format'[SOP Actuals Category] = "Depreciation" ) ) * -1


VAR InvestmentGainLoss = 
CALCULATE([Actual - GL Detail],
    FILTER( 'Financial Statement Format', 
        'Financial Statement Format'[SOP Actuals Category] = "Investment Gain Loss" ) ) * -1

RETURN
Revenue + Expenses + FixedAssets + Depreciation + InvestmentGainLoss


Budgets 2 = 
VAR Revenue = 
CALCULATE( [Budget] ,
    FILTER( 'Financial Statement Format', 
    'Financial Statement Format'[SOP Actuals Category] = "Revenue" ) )

VAR Expenses = 
CALCULATE( [Budget] ,
    FILTER( 'Financial Statement Format', 
    'Financial Statement Format'[SOP Actuals Category] = "Expense" ) )

VAR FixedAssets = 
CALCULATE( [Budget] ,
    FILTER( 'Financial Statement Format' , 
    'Financial Statement Format'[SOP Actuals Category] = "Fixed Assets Gain/Loss" ) )

VAR Depreciation = 
CALCULATE( [Budget] ,
    FILTER( 'Financial Statement Format' , 
    'Financial Statement Format'[SOP Actuals Category] = "Depreciation" ) )

VAR InvestmentGainLoss = 
CALCULATE( [Budget] ,
    FILTER( 'Financial Statement Format' ,
    'Financial Statement Format'[SOP Actuals Category] = "Investment Gain Loss" ) )

RETURN
( Revenue + InvestmentGainLoss ) - ( Expenses + FixedAssets + Depreciation )

Better/(Worse) 2 = [Actuals 2] - [Budgets 2]

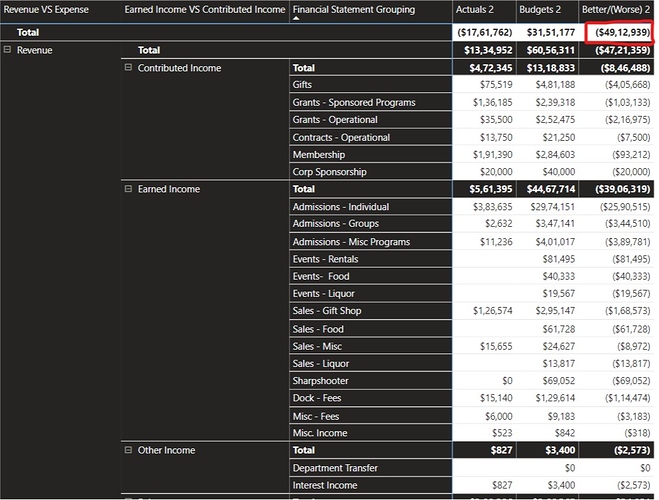
Below is the screenshot attached by using this formula as well for the reference -

As I’ve always advocated onto the Forum that one should go for the measure branching technique first and once we get the results or understand the concept about where we’ve faltered then we can go for the variables. Because it’s always difficult to trace the error while using variables since all the calculations all happening virtually.

@sam.mckay in his majority of his videos as well has been vocal about this technique. Since this technique is always very helpful whether we start building the formula or when it comes to error tracing.

I’m attaching the Excel as well as PBIX file of the working for the reference.

Hoping you find this useful and meets your requirements that you’ve been looking for. :slightly_smiling_face:

Please Note: Solution Page - 1 contains the results obtained by measure branching technique whereas the Solution Page - 2 contains the results obtained by variable technique. And I’ve also created separate measure groups for the Actuals, Budgets and Better/(Worse).

Thanks and Warm Regards,
Harsh

Desired Result.xlsx (29.0 KB)

Finance Model - Actuals vs Budgets - Harsh.pbix (418.1 KB)

5 Likes

@Harsh,

:clap: :clap: Fantastic work. Thanks so much for your assistance, and also for the detailed explanation.

  • Brian
1 Like