Formating issue when Combining Dynamic Grouping

Hi Fellow Power BI Users -

I have followed the examples in some of your videos for creating a dynamic grouping where I can select either the Top/Bottom customers navigating between sales/profit/margin data.

I was able to create all the supporting tables and measures and everything works fine except for one thing. When I have the margin separately in a chart, the figures are shown correctly …

image

but If I select the measure to combine all the three (sales/profit/margin) If I select the margin option the figures are shown in decimals instead of %.

image

Is there any way I can change this to get the % margin when I use alternatively the options sales/profit/margin?

Thank you as always for your help!

Lucia

Yes,

Check out the thread below.

You need to use the FORMAT function

Chrs

1 Like

Hi, Sam,

I just found it a second before you send me the link … lol

Now works perfectly :slight_smile:

Thank you so much!!!

Lucia

Hi Sam,

I think I spoke too fast. Now, while doing the check I’ve noticed that when I select the Margin % my Top ranking selection is ignored … any idea about why?

image

Thank you in advance for your reply,

Lucia

Will need to see formulas you are using to understand why this could be.

Just think about context quite deeply here. What is the context being applied to your formula? This will ultimately give you the answer to why you are getting these results.

Thanks

Hi Sam,

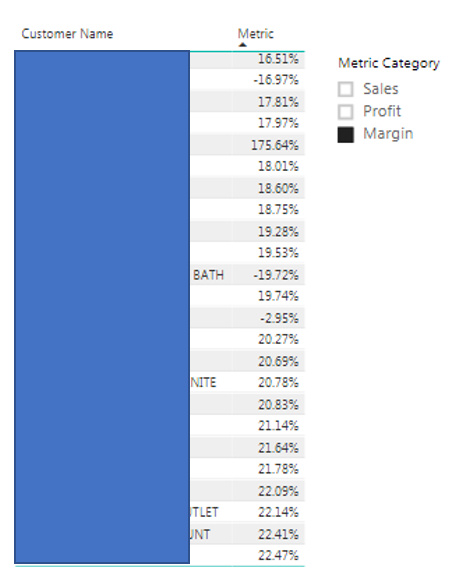
For the Metric Table, I used these formulas:

Metric Selected Sales = SELECTEDVALUE( 'Ranking Analysis Metric'[Metric Category], "Sales")

Metric Selected Profit = SELECTEDVALUE( 'Ranking Analysis Metric'[Metric Category], "Profit")

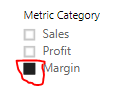
Metric Selected Margin = SELECTEDVALUE( 'Ranking Analysis Metric'[Metric Category], "Margin")

image

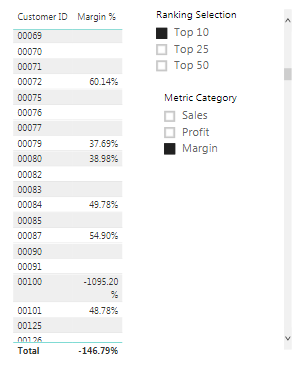
For the Top selection, this one:

`Top Ranking Select = IF(HASONEVALUE( 'Top Ranking Table'[Ranking Selection] ), VALUES( 'Top Ranking Table'[Rank Number] ), 1000000 )`

image

And for the combining selection this other one:

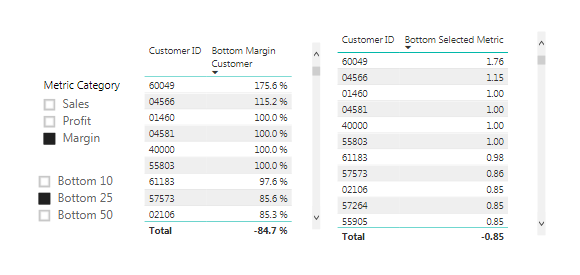
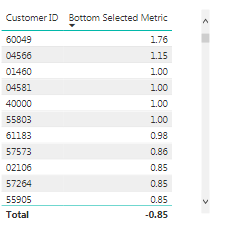
    Top Selected Metric =

    SWITCH( TRUE(),

    [Metric Selected Sales] = "Sales", [Top Sales Customer],

    'Ranking Analysis Metric'[Metric Selected Profit] = "Profit", [Top Profit Customer],

    'Ranking Analysis Metric'[Metric Selected Margin] = "Margin", FORMAT( [Top Margin Customer], "0.00%"),

    [Total Net Sales] )

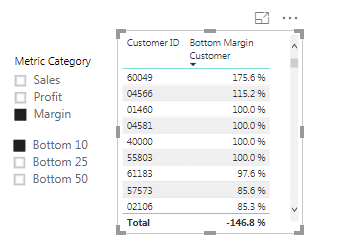
My Top Margin Customer formula is the following:

    Top Margin Customer = 
VAR 
    RankingDimension = VALUES( 'CUSTOMER MASTER'[Customer Name] )
VAR
    RankingSelection = 'Top Ranking Table'[Top Ranking Select]
RETURN
CALCULATE( [Total % Marging], 
    FILTER( RankingDimension,
        RANKX(ALL( 'CUSTOMER MASTER'[Customer Name] ), [Total % Marging] , , DESC ) <= RankingSelection))

And finally, the Total % Margin and Total Profit formulas that were made as follows, because, the COGS for the current working month are not available until around the 5th day of the next month. This is a data limitation due to an internal accounting process in the company. So for instance, this means that for the month of November sales show 0 COGS until around December 5th. This causes the problem that in the BI COGS calculations and if you select 2018 you are calculating the margin with 100% for all November sales. The same would apply to the profit calculation. So the intention of these measures is to filter out dates later than the end of the previous month.

Total % Marging =

VAR LastMontCogs = EOMONTH( TODAY() , -1)

VAR MarginReturn = CALCULATE( DIVIDE( [Total Profit], [Total Net Sales], 0),

FILTER( 'SALES DATA', 'SALES DATA'[SALES DATE] &lt;= LastMontCogs ))

RETURN

 MarginReturn

Total Profit =

VAR ProfitLastMonth = EOMONTH(today(),-1)

VAR ProfitReturn = CALCULATE ([Total Net Sales] - [Total Cost],

FILTER ('SALES DATA','SALES DATA'[SALES DATE] &lt;= ProfitLastMonth))

RETURN ProfitReturn

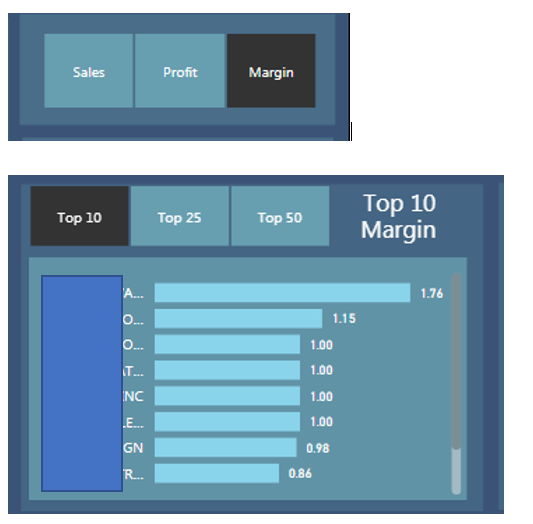
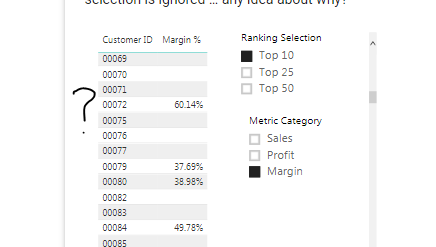
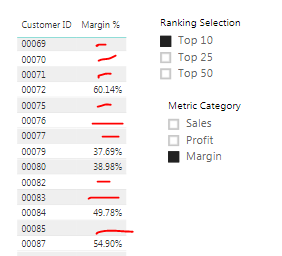
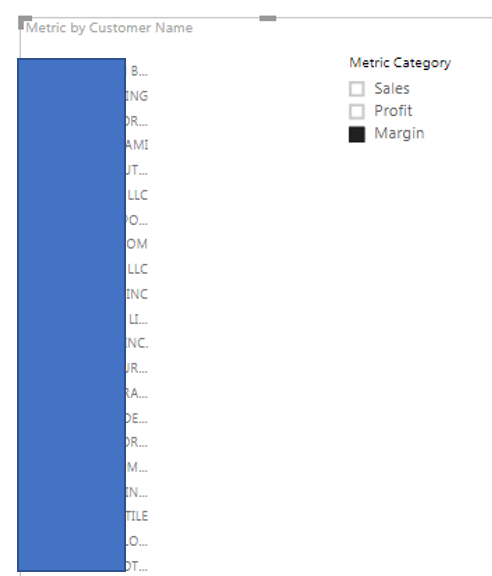
My goal is having the option to dynamically interact between sales/profit/margin in the same chart when I select my Top 10/25/50 customers. The filters are working perfectly fine when I select sales or margin within my Top 10, 25 or 50. The issue is only when I select the profit option if I use the FORMAT function to edit the values for being shown as % istead of decimals.

Please, let me know if you need further info …

Thanks!

Lucia

I’m confused is this a different issue now to what you showed before?

image

This seems completely different?

Please let me know.

If it’s just one problem all you need to do is add the formulas which matter for that.

Then I can really focus specifically on why that isn’t working.

Thanks for your assistance.

I’m also not sure why you need to use the FORMAT function around the profit result. You should really only need to do this around margins to create a %.

Sorry just a little confused as this seems a bit different to your initial question now.

Also this doesn’t need to be this complex.

There’s a much simpler way to do this.

Total Profit =

VAR ProfitLastMonth = EOMONTH(today(),-1)
VAR ProfitReturn = CALCULATE ([Total Net Sales] - [Total Cost],
FILTER ('SALES DATA','SALES DATA'[SALES DATE] &lt;= ProfitLastMonth))

RETURN ProfitReturn

Try to use my measure branching methodology here.

Calculate total sales, total costs, and total profits individually in measures.

Then all you need to do for margins is DIVIDE( total profit, total sales)

If you are looking to complete any time comparison type work, use this pattern.

Sales LY = CALCULATE( [Total Sales], DATEADD( Dates[Date], -1, YEAR ) )

You can jump back to any day, month, quarter and year using exactly the same pattern.

See how you go with some of these ideas.

Thanks
Sam

1 Like

Thank you, Sam, for your reply,

I am sorry for haven’t’ been clear on my explanation. My issue has nothing to do with the measures for total sales, total cost, total profit or total margin and it remains the same as my initial comment. The problem is basically that the solution you proposed for converting my profit margin to % instead of decimals, using the FORMAT function is not working in the scenario I am trying to create.

I’m using the dynamic Grouping metric to get sales, profit, and margins in the same table and in conjuntion with the Top/Bottom dynamic metric as well.

Everything works fine and I can select any of these metrics getting the correct results, BUT, when I select the “Margin” option, it is showing the values in decimals.

image
image

To resolve this, I tried to use the FORMAT function as you recommended, to modify the results and being able to get the values as % but after applying this function to the measure the table is showing blanks … No idea why.

image

This is the formula used:

Selected Metric =

SWITCH( TRUE(),

[Metric Selected Sales] = "Sales", [Total Net Sales],

'Ranking Analysis Metric'[Metric Selected Profit] = "Profit", [Total Profit],

'Ranking Analysis Metric'[Metric Selected Margin] = "Margin", FORMAT([Total % Margin], "0.00%"),

[Total Net Sales] )

I hope this clarifies the issue.

Thanks!

Lucia

Ok got it now.

Just wrap this with logic like the below

IF( ISBLANK( Total%Margin), BLANK(), FORMAT([Total % Margin], “0.00%”) )

That should do it.

1 Like

Thank you, Sam,

Now it works fine, but when I try to create a visual for this, is not working when “profit” is selected just only if the figures are presented in a table :frowning:

Do you know if there’s something I can do to resolve this?

Thanks,

Lucia

Sorry I’m confused again?

When profit is selected, you’re having problems?

The images have margins selected, so just not sure what that means

What visual is not working? and which formula feeds that visual?

Sam

I’m sorry Sam, my mistake. I wanted to say “Margin”. The formula works fine if I keep the results in the table. When I select a stacked bar chart it doesn’t work properly. There’s no bars in the chart.

The formula that feeds that visual is:

Grouped Selected Metric =

SWITCH( TRUE(),

[Metric Selected Sales] = "Sales", [Total Net Sales],

'Ranking Analysis Metric'[Metric Selected Profit] = "Profit", [Total Profit],

'Ranking Analysis Metric'[Metric Selected Margin] = "Margin", IF( ISBLANK([Total % Marging]), BLANK(), FORMAT( [Total % Marging], "0.00%")),

[Total Net Sales])

I hope is clear now :slight_smile:

Lucia

Ok sure,

Yes unfortunately the result turns into a text value, that is why nothing shows on the chart.

It’s really only useful here for tables of information.

This is probably the one restriction with this technique.

1 Like

Thank you for the clarification, Sam. Very appreciated your guidance and support!

What I’m gonna do is to keep sales/profit in the same report and a different one just for profit …Is not the most elegant option, but at leat, I’ll get what I’m looking for :slight_smile:

Lucia