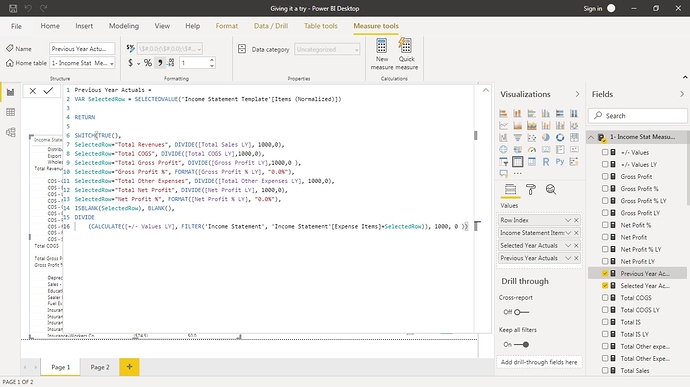
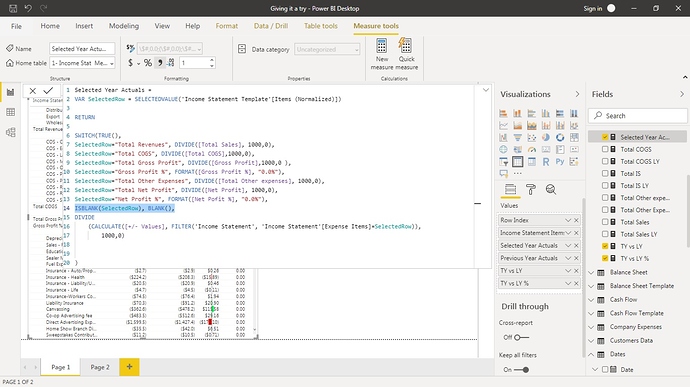
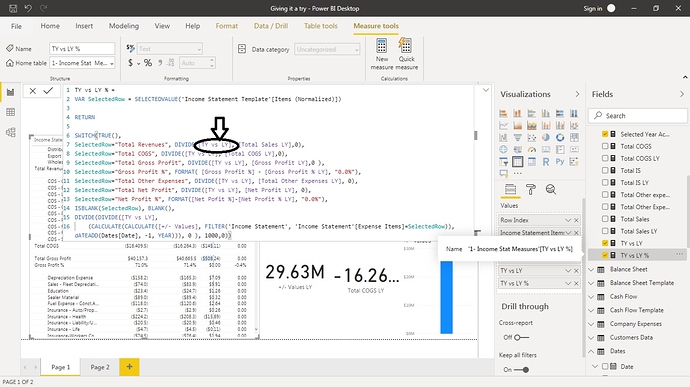
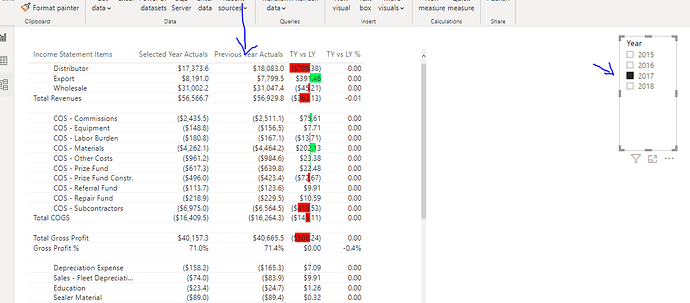
I went through the Financial Dashboards videos and tried to do replicate the file on my own. I faced the following issues, and appreciate any guidance:
-
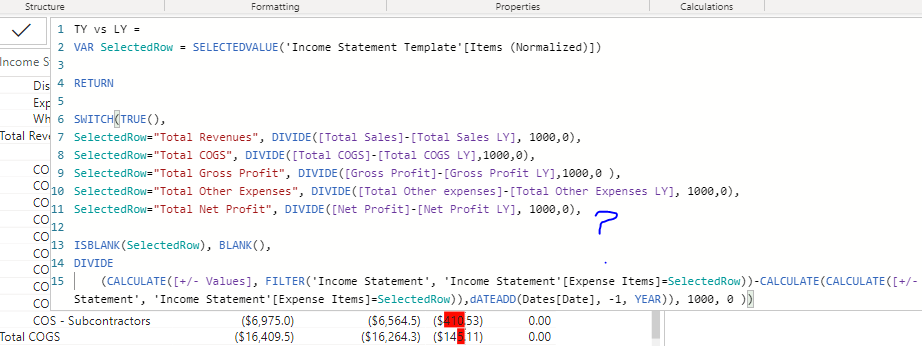
Double Calculate instead of LY value:
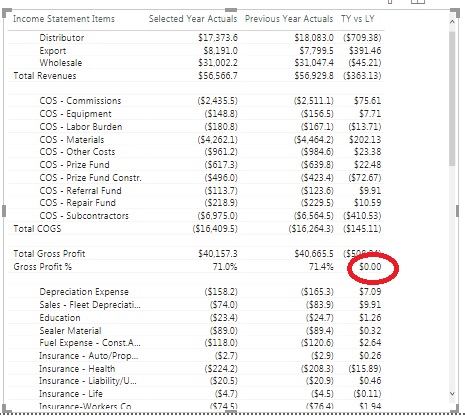
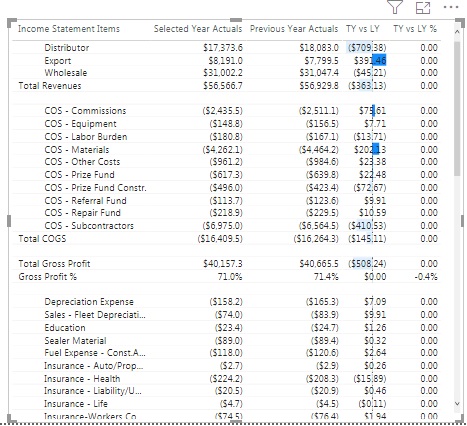
In the video called Time Comparison calculation, at min 6:53, it is said that instead of doing a double CALCULATE function, we can use one CALCULATE with the LY measure. I’ve used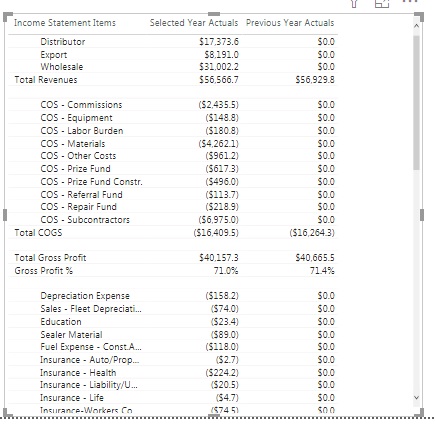
 Giving it a try.pbix
 (749.4 KB)
Hi @dotbuilt, we aim to consistently improve the topics being posted on the forum to help you in getting a strong solution faster. While waiting for a response, here are some tips so you can get the most out of the forum and other Enterprise DNA resources.
-
Use the forum search to discover if your query has been asked before by another member.
-
When posting a topic with formula make sure that it is correctly formatted to preformated text </>.
-
Use the proper category that best describes your topic
-
Provide as much context to a question as possible.
-
Include demo pbix file, images of the entire scenario you are dealing with, screenshot of the data model, details of how you want to visualize a result, and any other supporting links and details.
I also suggest that you check the forum guideline https://forum.enterprisedna.co/t/how-to-use-the-enterprise-dna-support-forum/3951. Not adhering to it may sometimes cause delay in getting an answer.
I had a quick look at this.
- Looks like PY actuals works on your demo?
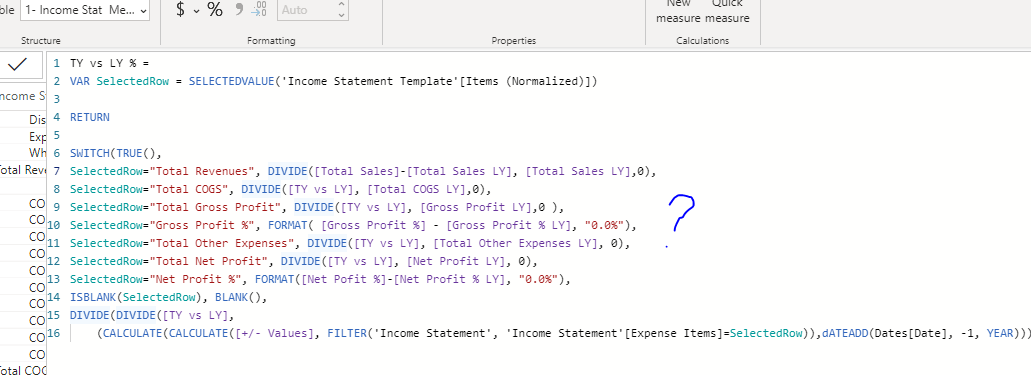
- This just looks like a formatting issue

this part above seems to be missing from your TY vs LY measure
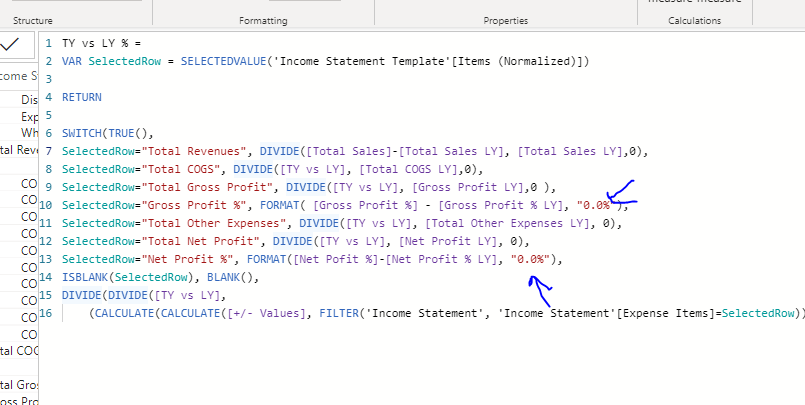
- Again this looks simply like a formatting issue in your formula.
Currently the formula doesn’t know that the values need to be a percentage
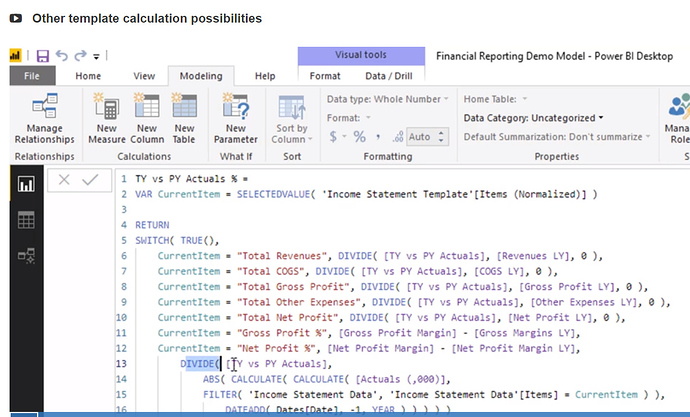
You’ll see here below in this image from the video that your formula setup is different to the example
You need to make sure you can turn the format of the formula into a percentage.
Currently because of the above you can’t do that.
Try these things I’ve mentioned above.
Thanks
Sam
Hi @dotbuilt, a response on this post has been tagged as “Solution”. If you have a follow question or concern related to this topic, please remove the Solution tag first by clicking the three dots beside Reply and then untick the check box. Also, we’ve recently launched the Enterprise DNA Forum User Experience Survey, please feel free to answer it and give your insights on how we can further improve the Support forum. Thanks!


 Giving it a try.pbix (749.4 KB)
