In looking at ths Financial Example, Balance Sheet Report, EACH of the columns is mostly the SAME. Do I have a older version of the model or is the model not meant to show any variance in key elements like Cash, Accounts Receivable, Inventory, etc.?

Hello @SiliconValley,
Thank You for posting your query onto the Forum.
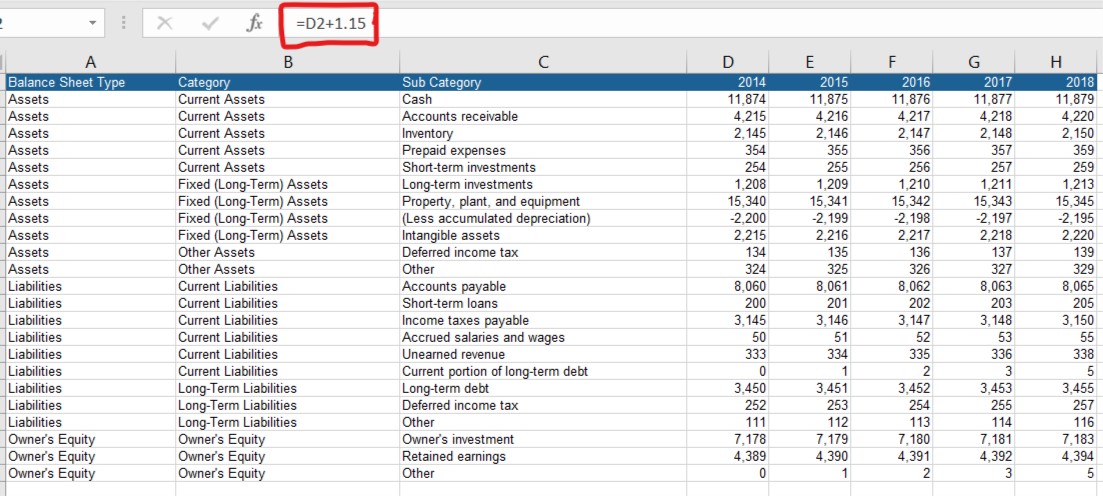
The data has been created from the educational point of view and to specifically explain the concept of Financial Reporting in Power BI. So if you might have gone through the data you shall notice that all the next year’s figure are calculated on the basis of previous year’s figure by adding a factor of 1.15. Below is the screenshot provided for the reference of the data -
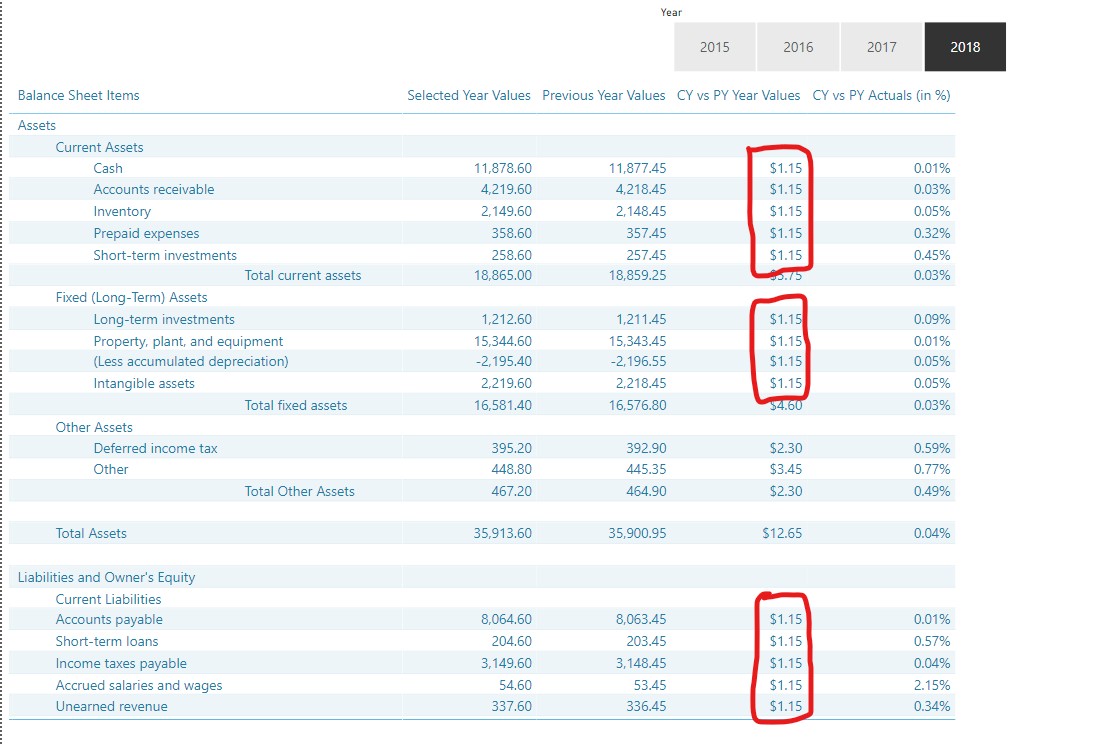
And so that’s why the variance in the Balance Sheet in Power BI is also consistent. Below is the screenshot provided for the reference -
Similarly, if you go through the Cash Flow Statement Data you’ll observe the same thing. There the formulas has been erased from the Excel file but if you take the figure of 2015 of line item “Cash receipts from customers” and divide the 797180/693200 you’ll get the same factor of 1.15 consistently.
I’m also attaching the working of the PBIX file for the reference.
Hoping this helps you. 
Thanks and Warm Regards,
Harsh
Financial Reporting - Harsh.pbix (860.6 KB)
1 Like
Hi @SiliconValley did the response provided by @Harsh help you solve your query? If not, how far did you get and what kind of help you need further? If yes, kindly mark the thread as solved. Thanks!
Hi @SiliconValley, a response on this post has been tagged as “Solution”. If you have a follow question or concern related to this topic, please remove the Solution tag first by clicking the three dots beside Reply and then untick the check box. Also, we’ve recently launched the Enterprise DNA Forum User Experience Survey, please feel free to answer it and give your insights on how we can further improve the Support forum. Thanks!