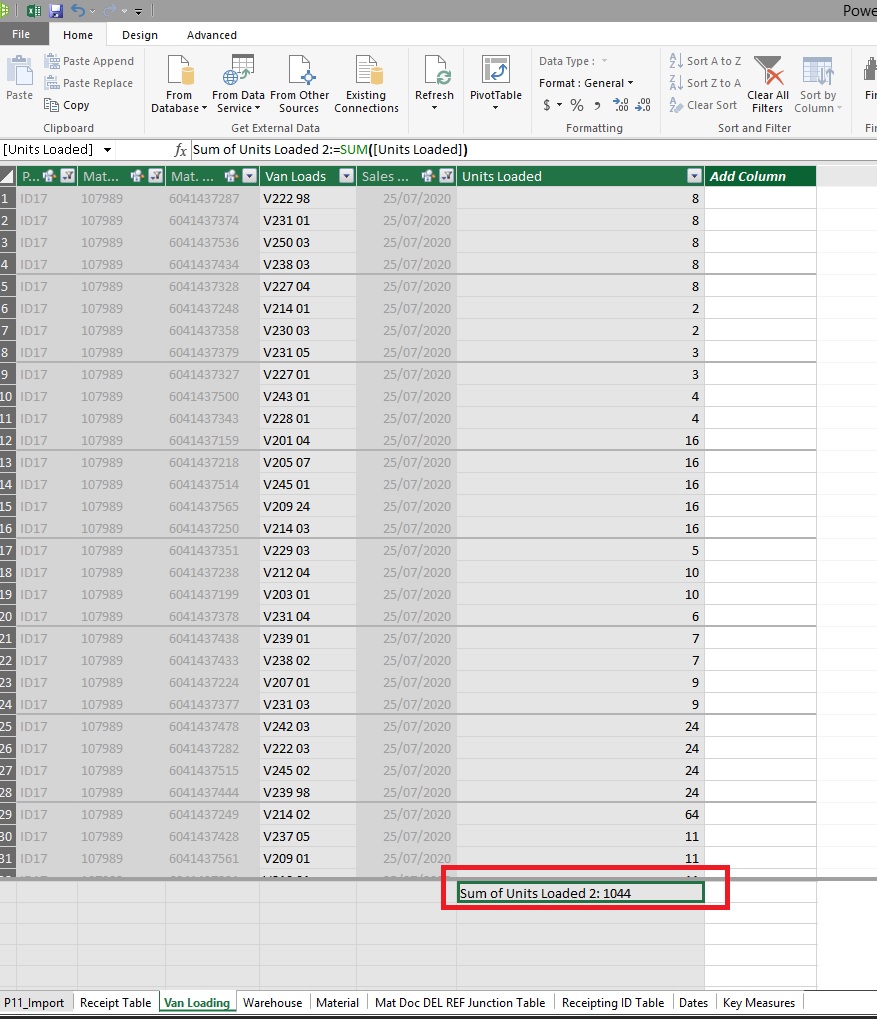
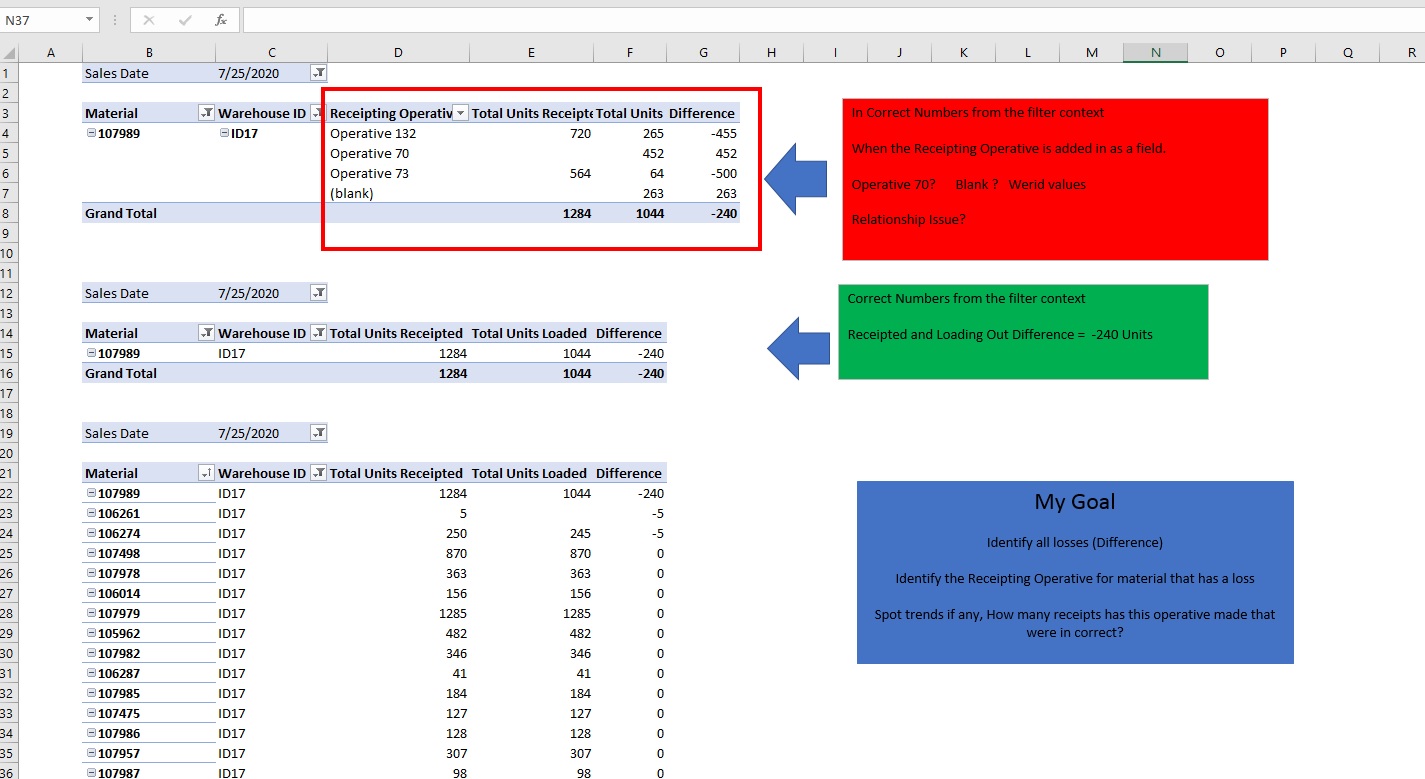
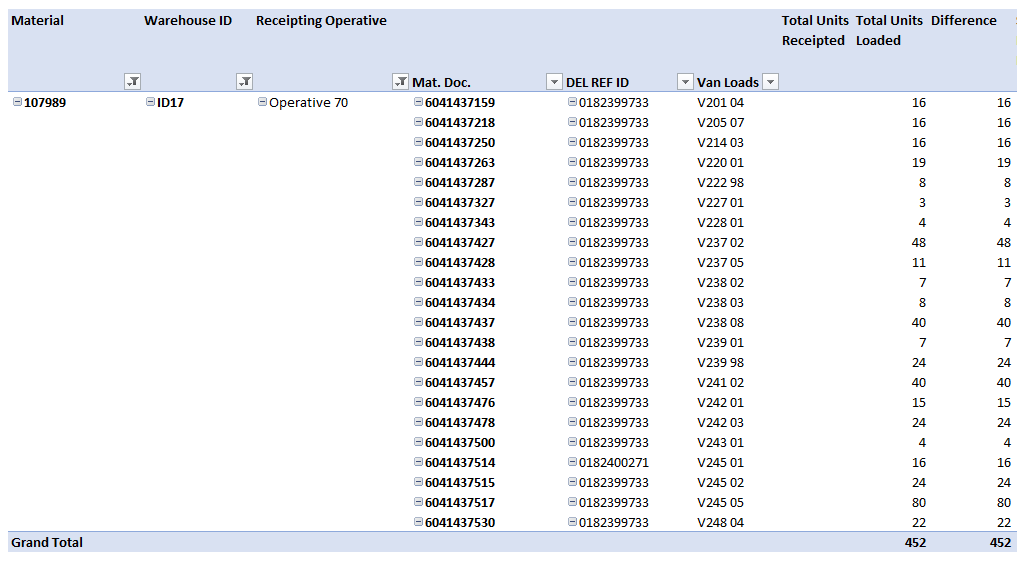
There may be a data quality issue here, it appears that Operative 70 appears in your pivot because he is brought in with the “Total Units Loaded” measure - he is involved with Mat.Doc. 6041437159, which links to your filtered material and warehouse IDs
There is a blank for him in the Units Receipted column, because he is NOT listed on the lines for the Receipt Table.
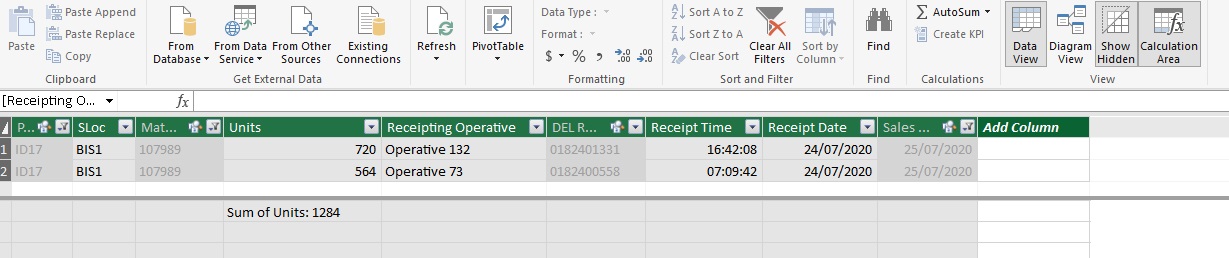
As for the completely blank field for operator, you seem to have some Mat.Doc. numbers that do not cross reference into the Mat Doc DEL REF Junction Table (see 6041437557 for example, it appears on the Van Loading table, but on the DEL REF table it is matched to a blank in the DEL REF ID column
Many thanks for checking this for myself, I will investigate further my data to see where I have modelled this wrong via Power Query.
From the original source data from SAP, I had to manipulate the DEL Ref ID using PQ , column duplicate, column fill up over the null values to forge a Link relationship between Mat Doc. and Del Ref ID
That was my initial struggle at the beginning, I’m guessing that I gone wrong there somewhere in shaping the core data set source.
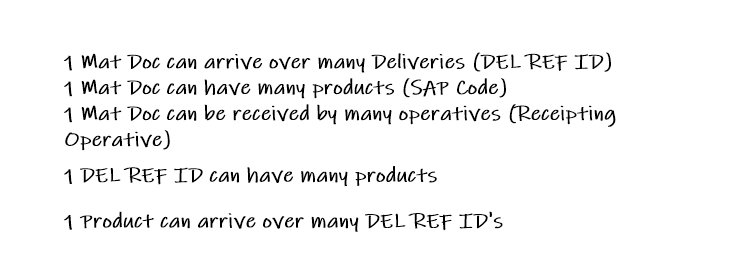
I used one of Sam’s suggestions - Whiteboard to try and engage my brain into what the relationship should be and look like (Maybe I am overthinking this)
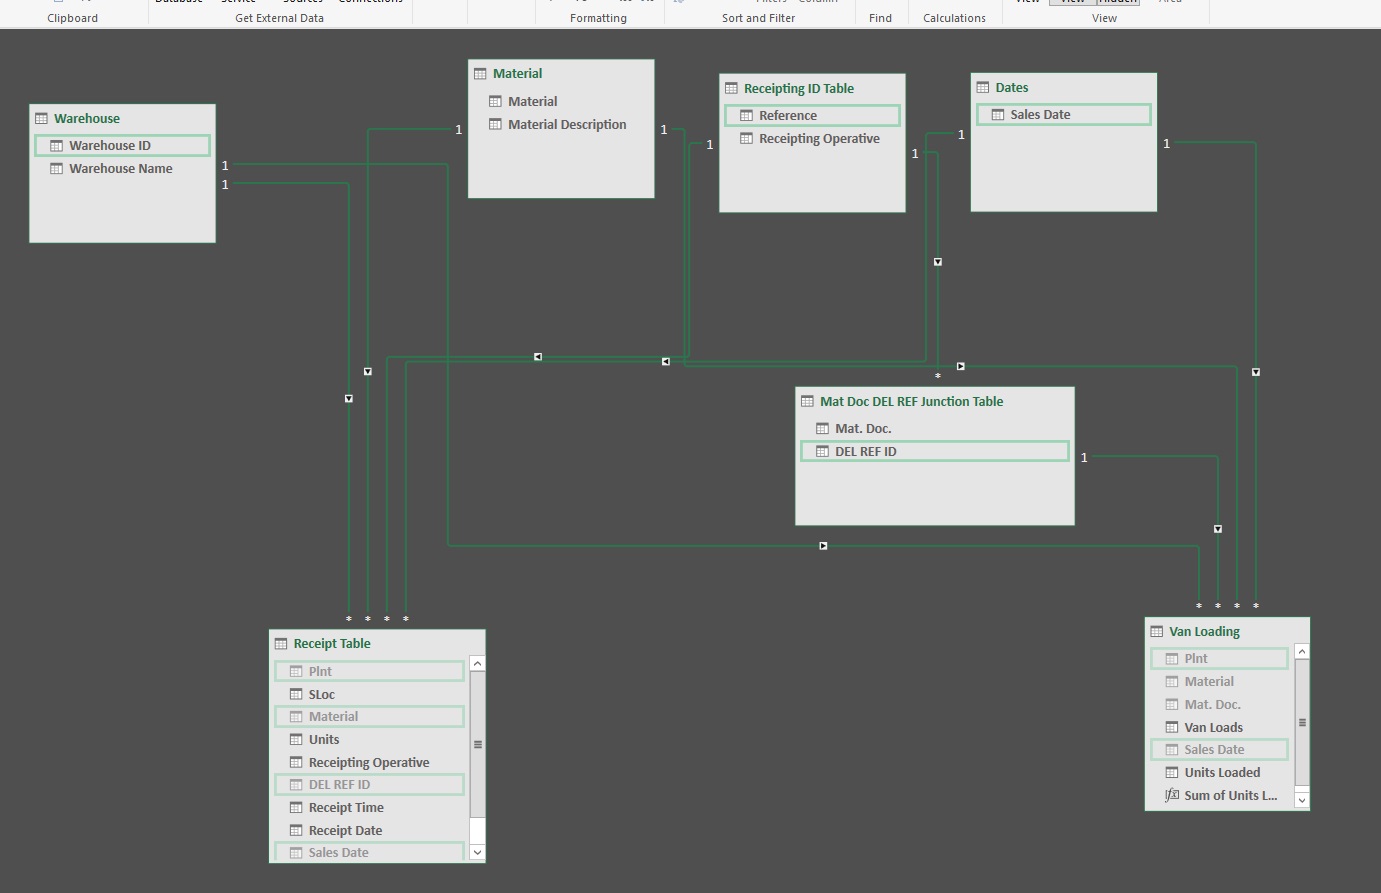
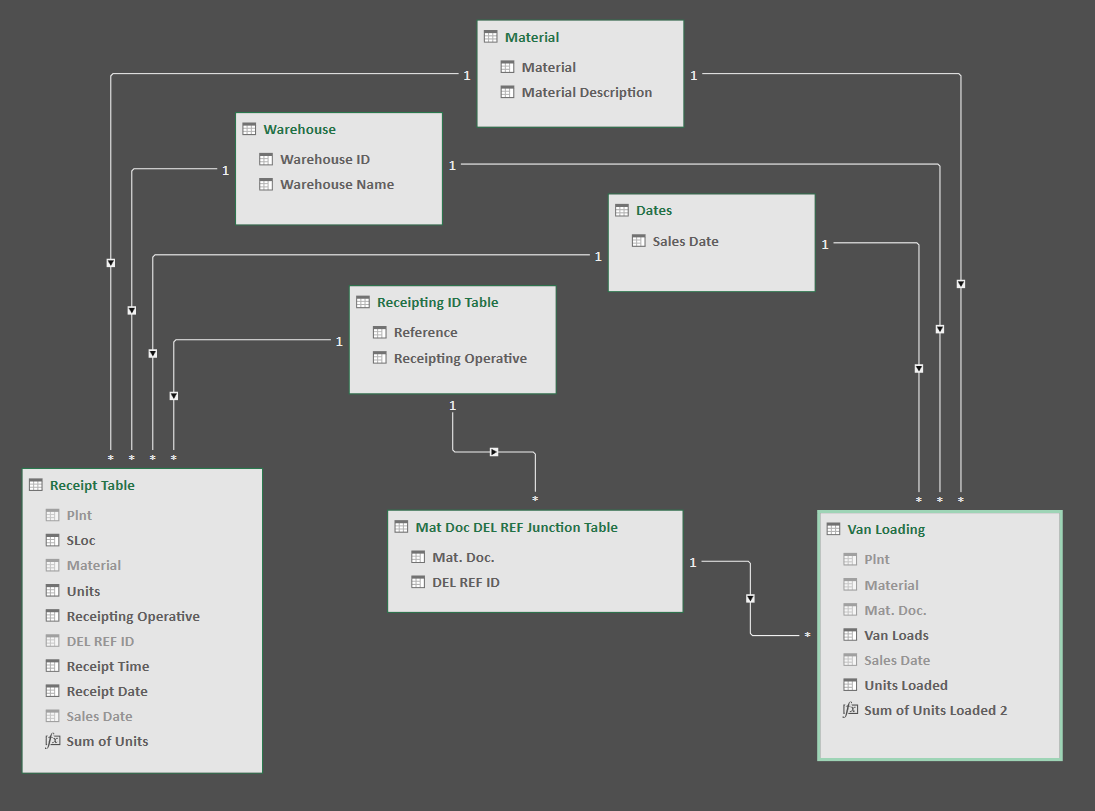
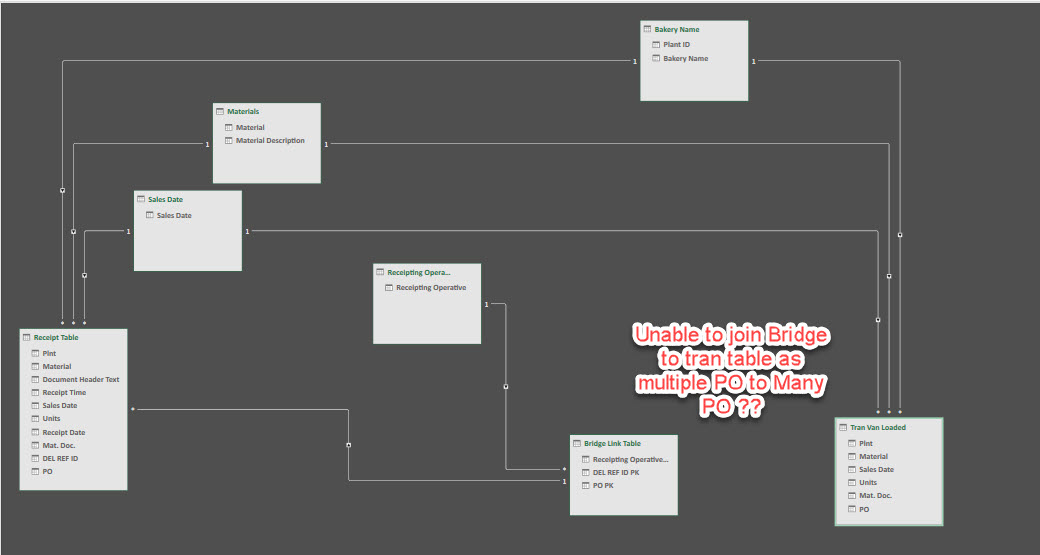
Using the Bridge Table is the closer I have got so far at linking the end Van Loading sum of material back to who receipted the material in the Receipt table.
Previous attempts threw up repeating number values for the receipting operative of bizarre relationship, obviously not able to flow back up the filter line and grab the name of receipting operative, the DEL REF/Mat Doc bridge was my next attempt at solving that issue.
I’ll will clean up any identifing company data of the raw Sap Data export and repost that as this may make more understanding of the original data state before I start my modelling journey.
Bridge tables are very useful, as long as they are modeled correctly. And yes, it can be very challenging to get the initial data into the right ‘shape’ to commit to your Power Query model.
I personally subscribe to the whiteboard model whenever possible - so don’t give up on that!
To take the whiteboarding a step further, consider tracing a handful of your records through your model
In your case, I would print all the records related to a given Mat.Doc number (for example), and make sure that as you flow through the model, you can connect all of the steps.
if that is too complex, then some detective work like I did (adding related fields to your pivot where things look odd) can also be invaluable.
Good luck with it - and be sure to create a new post if you come up with different questions related to this project!
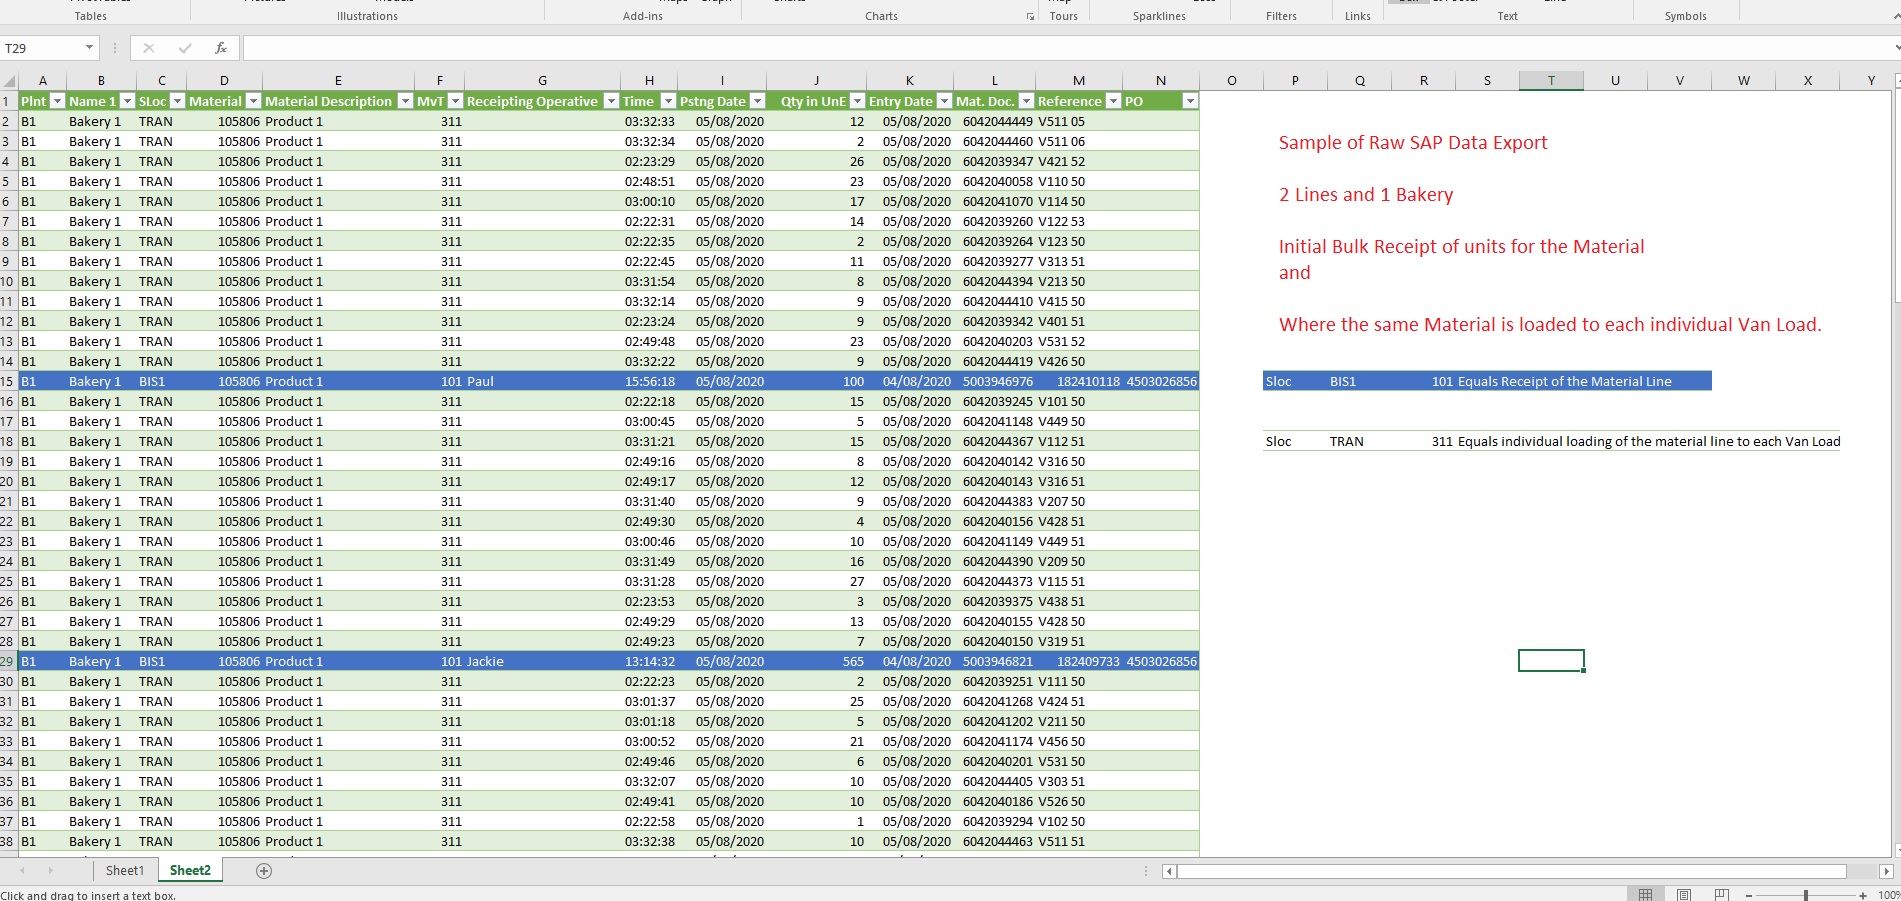
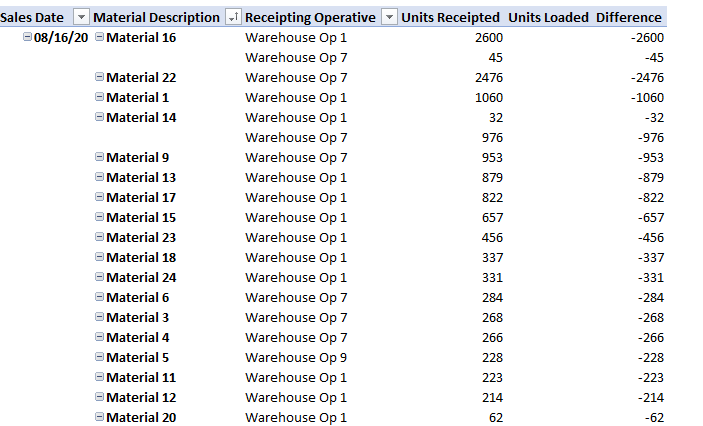
Well, I’m still seeing some confusion here… when I look at the first 15 rows of your table, the receipt line (in blue) shows a quantity of 100 - but the loading lines above that equal to a quantity of 165 ?
Assuming that this is because you have filtered both the material and the Plnt, I’ll move on because your reciept line may not have been structured to re-total with the filter.
However, at line 43, you have a negative quantity of 665 on a receipt line, but that line shows no PO to use as reference - you need something to handle this. (Once again I’m going to ignore that the total on the receipt line does not match the loading lines above)
I see another negative with the same issue futher down the page…
other than that, yes, filling the PO number up seems like a good way to have a unique key. By their nature POs should not repeat within the same system, so unless the PO is assigned outside of your company you should be good.
ah ha - then that does make more sense, and if, as I mentioned earlier the receipt line total includes items that were not in your filtered data (as you begin to build out a smaller version of the model), then yes things make a lot more sense.
And I still agree - PO number looks like something to use as a key
Hi @DarrenG , did the response provided by @Heather help you solve your query? If not, how far did you get and what kind of help you need further? If yes, kindly mark the thread as solved. Thanks!
Your help and guidance has been very helpful, in particular using smaller data sets initially.
I’m still a little confused with how to achieve the following:
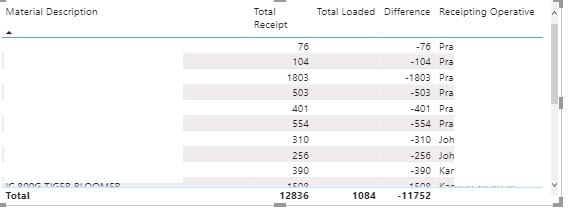
A Table in Power BI or Excel Pivot Visual in Rows
Columns: Product Receipted Units, Loaded Units and difference.
That appears to be fine until I add operative, Either Loading disappears or Receipting Units vanish, figures appear from nowhere and all the operatives appear with units for each product etc etc,
I know this is the relationship data structure but I’m a little lost of what would work
Do I need a Receipting Operative field in Receipt Table and also the Van Loaded Tran table?
Maybe that is the answer?
Gone down the road of:
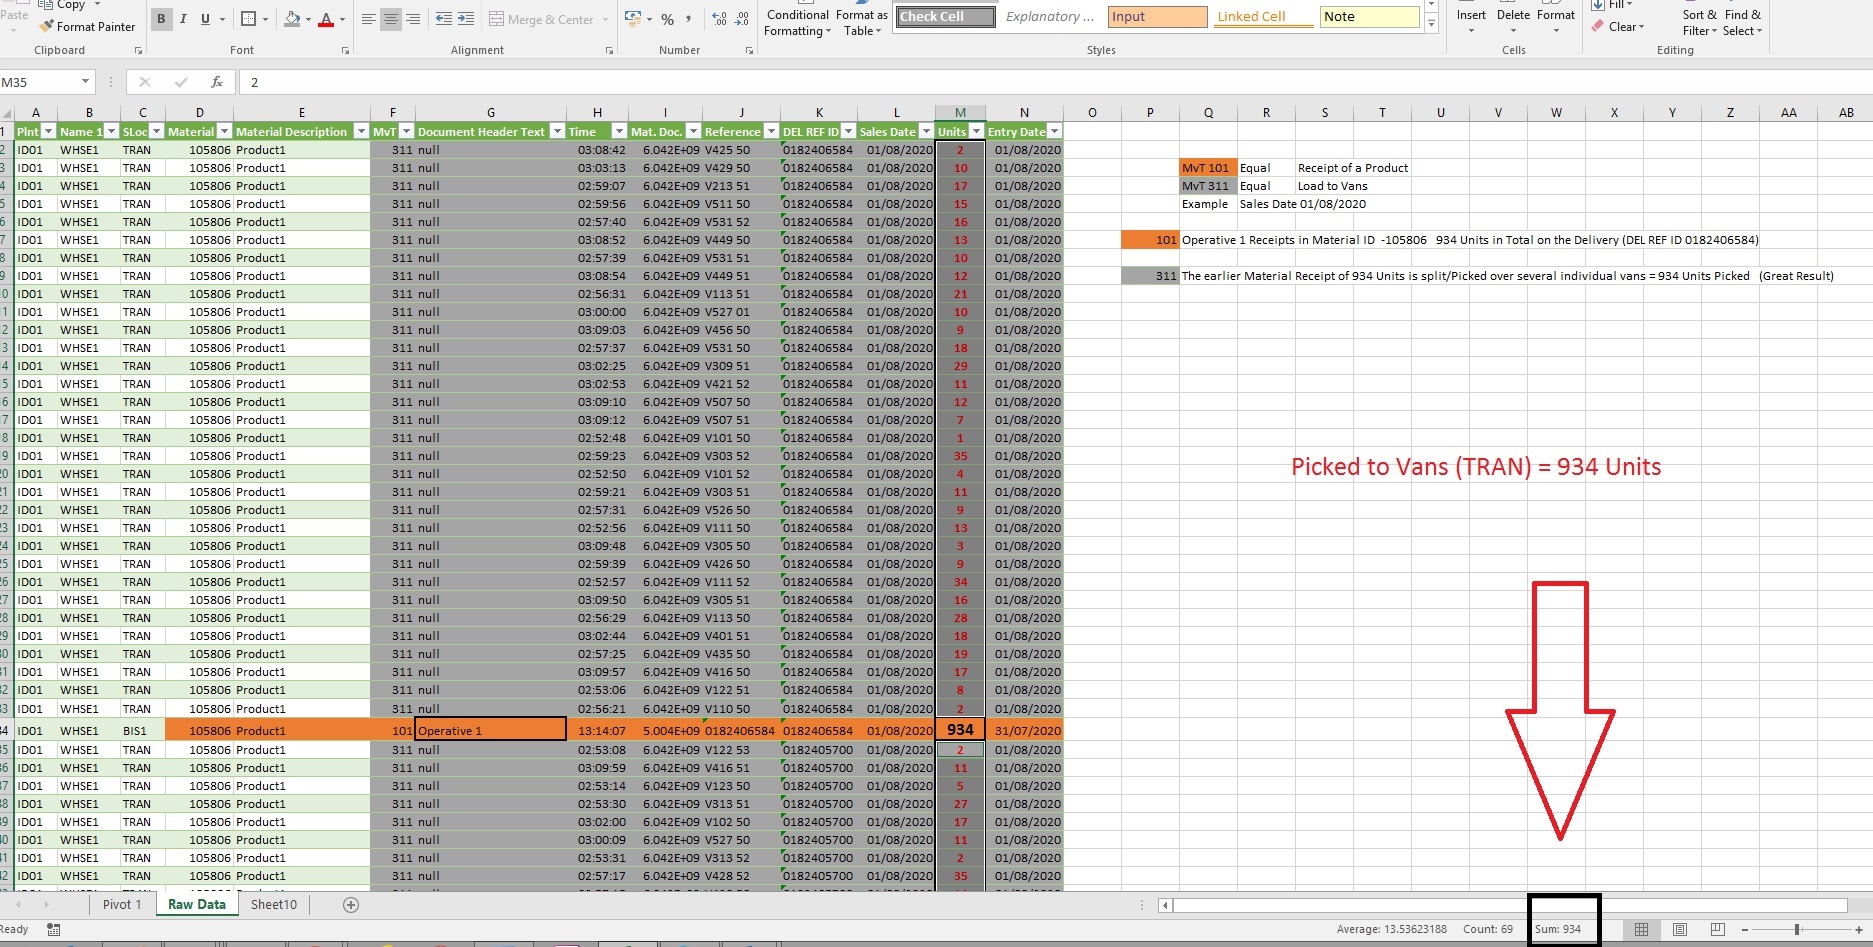
Each receipt provides a Unique DEL REF ID, Linked this to the PO on the same ROW, Filled upwards so Each Individual Mat.Doc ID has the same PO Number Assigned.
Effectively tie in DEL Ref ID to a batch of Material Docs that are later loaded.
I think my logic is there, getting there but I also seem to be getting more confused via the minute LOL
Please find attached an Excel Data Model Copy of similar data but with Company data masked/changed.
I have tried to include as many examples as possible of what I am attempting to achieve along with screenshots.
Hope that is enough to explain, if not let me know and I can assist with any questions.
Really appreciate you valuable experience and help!
I have had another bash and generating a Link/Bridge table but failed miserably on joining the Bridge table to the Tran loaded Table as the PO was still Many 2 Many level, I’m at a loss now with that
I’ve got a feeling that i can’t see the wood for the trees scenario and you will hopefully spot my obvious mistakes, maybe I don’t need a link table, I’m unsure?
Later KPI Goals will include when I get this bit right:
How many individual deliveries
How many were wrongly receipted in
Count of many incorrect deliveries an operative has made in a month etc etc.
okay - I think that given your source data is a large flat file, we can simplify this with just the use of an INDEX column to join everything
So, to your SAP_IMPORT table, I added an INDEX
I also saw you were having issues with the fill-up command - so I believe I have that fixed as well (your flat table was showing null as a text value, not as the type of null that PowerQuery understands - this may not be a problem with your actual import table, I don’t know)
next, I made sure that the index column flowed through to your Recipting and Van Loading tables
removed joins to the bridge table (probably the reason that wasn’t working is because you had tables like Bakery Name linked to both tables, so it confused the system on what filter took precedence)
removed extra joins to the Van Loading table, and connected it just to the Recipting table via the index column
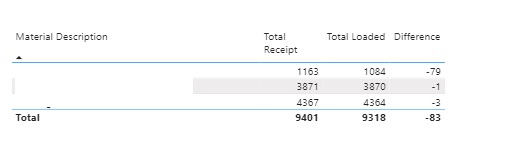
Checked the model this morning and yes that seems to make the numbers look much better.
Looks like I had got lost in a Link table train of thought that I didn’t actually need.
You were spot on with the fill up issue that was frustrating , I went down the replace a blank with a ‘null’ route after a Google search but it would not play ball, not sure what you did differently but thanks!
I’m curious with the Index key, Looked at how you have set the relationship up, essentially linking both fact tables together and it worked, my learning so far down the Power Query route was that I should avoid linking 2 fact tables together, however your solution works, probably why I got so lost.
If you could break down your thought process of how that works in the link between the 2 Fact tables in terms of filter context, I would be very grateful as this would help my learning.
For example:
How does Index 35 in the Receipt table relate to an Index number key in the Tran Loaded Table as there is no number 35 for the One to Many approach - I’m confused how that works if that makes sense.
I also see that you have removed the filters from each look up to the Tran Table (Plant, Material etc) - I guess I got that wrong too
trying to take these in order - the fill up issue was simply one of needing to add a couple of quotes to the null you were replacing, so that your code line of
“null” is text with the letters n u l l, while null is actually a null value in PowerBi (something you learn with trial and error). Unfortunately, just using the replace button in the editor isn’t enough, you have to go in and add the quote marks to the code after it is created.
And, now that I’m less tired, I realize the Index Key is not quite the right idea - because you have multiple lines on the Loading table that need to link to a single line on the receipting table. So I will get that fixed and loaded later this morning.
The reason that I thought to link them is simple, in my own work, I have a table for “Invoice Header” and a table for “Invoice Line” - I have multiple columns that I need from the Invoice Header, which should not be repeated on every Line (simply bloats my model).
So instead, the Invoice Line only has the Invoice Number, which also appears on the Invoice Header - and I link the two tables so that relationships flow down from the DIM tables to the Invoice Header, and then through that to the Invoice Line.
So, your Receipt Table is like my Invoice Header
I’ll get the revised copy up shortly, sorry about that!