Hi,
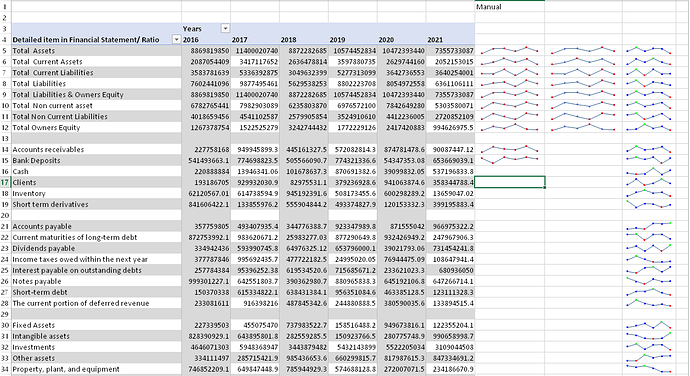
I’ve googled for any way to automatically add a new column to a pivot table and insert sparklines inside it automatically but I was not able to do it automatically.
All I was able to do, was just to inset a sparkline in the cell far after the last column of the pivot table, then drag it till the end.
Is there any way to include it inside the pivot table in order to be updated automatically when data changes?
And if it is not possible, is it possible to insert a formula beside the pivot table that could be updated automatically with my interaction to drag the cell down to update the sparklines?
My point is to get an updated sparkline automatically when data inside the pivot table changed and add new rows automatically.
Thanks
The attached file includes a sheet titled “Sparklines-Inside-PivotTables” for the pivot table. K column includes the manually inserted sparklines, and as you can see I need to manually drag the cells down manually to update the sparklines.
My request please if there is any way to update the sparklines automatically shown in column M .
Or maybe there is any way to insert a table in the column M and let it get updated automatically according to the contents of the pivot table, then insert the sparklines inside the table cell, so when the pivot table gets updated the newly added tables get updated as well, and in turn, the sparklines get updated as well.
Thanks a lot and too much appreciated your valuable time reading my post and helping me.
OriginalFile-PowerQuery-PivotTable-Sparklines.xlsx (155.5 KB)
HI there,
I’m just wondering if you have posted this question to Excel (vba/pivot table) Community.
Did you check on Youtube? (there is a lot of videos on pivot tables and sparklines)
You will likely have to create something in vba.
I my experience using excel, you can create a range name (data) that will automatically change when you update your data (can’t remember exactly what command to get your full range when it changes).
When you create your graphs/sparklines it will reference your range name(that will change automatically with data.)
I hope this helps
thanks
Keith
Thanks a lot for your valuable time reading my message and helping me.
HI there,
I’m just wondering if you have posted this question to Excel (vba/pivot table) Community.
You mean here in the EnterpriseDNA or another forums? if you mean other forum, then yes I did but no one replied me back, so I thought to ask here.
Did you check on Youtube? (there is a lot of videos on pivot tables and sparklines)
You will likely have to create something in vba.
Yes there are dozens of youtube videos about sparklines, but all of what I’ve watched was about how to create and adjust settings, but I am looking for something else, which is how to extend it automatically when pivot table values increased or extended?
I my experience using excel, you can create a range name (data) that will automatically change when you update your data (can’t remember exactly what command to get your full range when it changes).
Yes, I tried adding range name (Ctrl+F3) and also tried creating a table and then add sparklines to the cell inside the range or inside the table, but still the sparklines range needs to be updated manually and not being updated automatically when pivot table rows increased.
When you create your graphs/sparklines it will reference your range name(that will change automatically with data.)
Yes, it does for the cell or set of cells where you locate it, but if there are extra rows being added or updated, you will need to drag the cells contain the sparklines down to the last updated row, and this is why I am looking for an automatic way.
I hope this helps
thanks
Keith
Thanks a lot, if you have few minutes to check attached file, you will see my point.
Thanks @Keith
Hi @MGadAllah ,
Thank you very much for posting your question in the forum.
The truth is that I have not used VBA to create macros in Excel but I have created the following code to see if it can help you with what you need.
Private Sub Worksheet_PivotTableUpdate(ByVal Target As PivotTable)
Dim i As Integer
  Dim Position As Range
  Dim Rng As Range
  Dim MaxRows As Integer
  MaxRows = Cells.SpecialCells(xlLastCell).Row

  For i = 5 To MaxRows
    Set Position = Worksheets("Sparklines-Inside-PivotTables").Range("M" & i)
    Set Rng = Worksheets("Sparklines-Inside-PivotTables").Range("E" & i & ":J" & i)
    Position.SparklineGroups.Add Type:=xlSparkLine, SourceData:=CStr(Rng.Address)
    Position.SparklineGroups.Item(1).Points.Markers.Visible = True
    Position.SparklineGroups.Item(1).Points.Markers.Color.Color = vbBlue
    Position.SparklineGroups.Item(1).Points.Highpoint.Visible = True
    Position.SparklineGroups.Item(1).Points.Highpoint.Color.Color = vbGreen
    Position.SparklineGroups.Item(1).Points.Lowpoint.Visible = True
    Position.SparklineGroups.Item(1).Points.Lowpoint.Color.Color = vbRed
    Position.SparklineGroups.Item(1).Points.Firstpoint.Visible = True
    Position.SparklineGroups.Item(1).Points.Firstpoint.Color.Color = vbBlue
    Position.SparklineGroups.Item(1).Points.Lastpoint.Visible = True
    Position.SparklineGroups.Item(1).Points.Lastpoint.Color.Color = vbBlue
 next i

 End Sub
Regards
OriginalFile-PowerQuery-PivotTable-Sparklines.xlsm (163.0 KB)
Thanks a lot for your valuable time, and too much appreciated!
Hi @MGadAllah,
Did the solution I shared help you?
It is to know if it has worked for you with your real data.
Regards,
Yes, it does.
Hi @MGadAllah,
Glad to have been able to help you.
If you are so kind, can you mark the answer as a solution and create a new thread for this new query?
Regards,
Sure, really much appreciated your valuable time replying to my thread and helping me.
Hi @MGadAllah,
You can mark the answer where I shared the .xlsm file as a solution instead of the one you marked and you can post a new thread with the new query at:
And delete the last query in this thread.
Regards
Hi @MGadAllah,
Deletes only the last one that corresponds to the new query.
Regards
OK.
Deleted!

