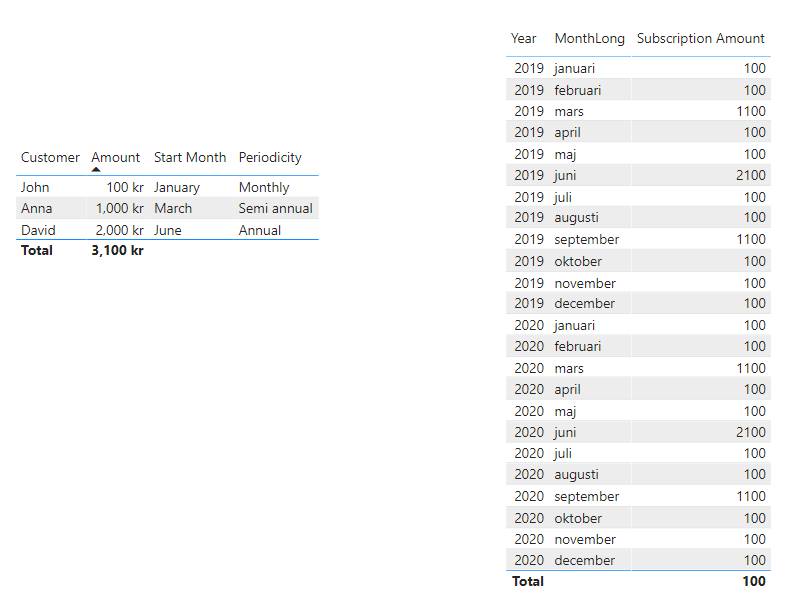
I have the source data as attached in the example. It is for a subscription service e.g. a magazine. The customer can decide to pay monthly, semi-annual or annually. The start month indicates when the amount is to be payed. For monthly fees it will be every month and for semi annually it will be the start month and start month + 6 eg march and September as in the example. I need to create a report that indicates the amount that will be collected from subscriptions each month based on this data. See example on the right. Would this be possible with DAX or do I need to expand the data in some way to be able to create this? All the amounts, periodicity etc are in one table and I of course have a standard date table.
Hi @Frede. I don’t think your example got attached properly I can’t see it anyway). If your could please re-attach, and also provide a work-in-progress PBIX (with sanitized date, if necessary) and a mock-up of your desired outcome, that’d be great.
Greg
One of DAX or Power Query (or perhaps both) can get you there I’m sure. Can you please provide your work-in-progress PBIX for the forum members to see how far you’ve gotten?
Greg
Thanks for posting your question @Frede. To receive a resolution in a timely manner please make sure that you provide all the necessary details on this thread.
Here is a potential list of additional information to include in this thread; demo pbix file, images of the entire scenario you are dealing with, screenshot of the data model, details of how you want to visualize a result, and any other supporting links and details.
Including all of the above will likely enable a quick solution to your question.
Firstly, the nature of the data itself is so small nothing conclusive can be said. If you’ve only these many clients and the collection of the months are fixed i.e. if you collect your semi - annually subscription amount in the month of March and annual subscription amount in the month of June then you can use the formula provided below for the reference to achieve the output as you’ve shown above -
This solution is provided keeping in mind you’ve these many clients and collection months are fixed. And also keeping in view of the consideration the output that you’re looking for (As provided/mentioned in the first post). If that’s not case, then please expand your data and specify the scenario alongwith the result that you’re looking for.
Also the language used in subscription table is different than the language used in the date table. Please maintain consistency throughout the data model.
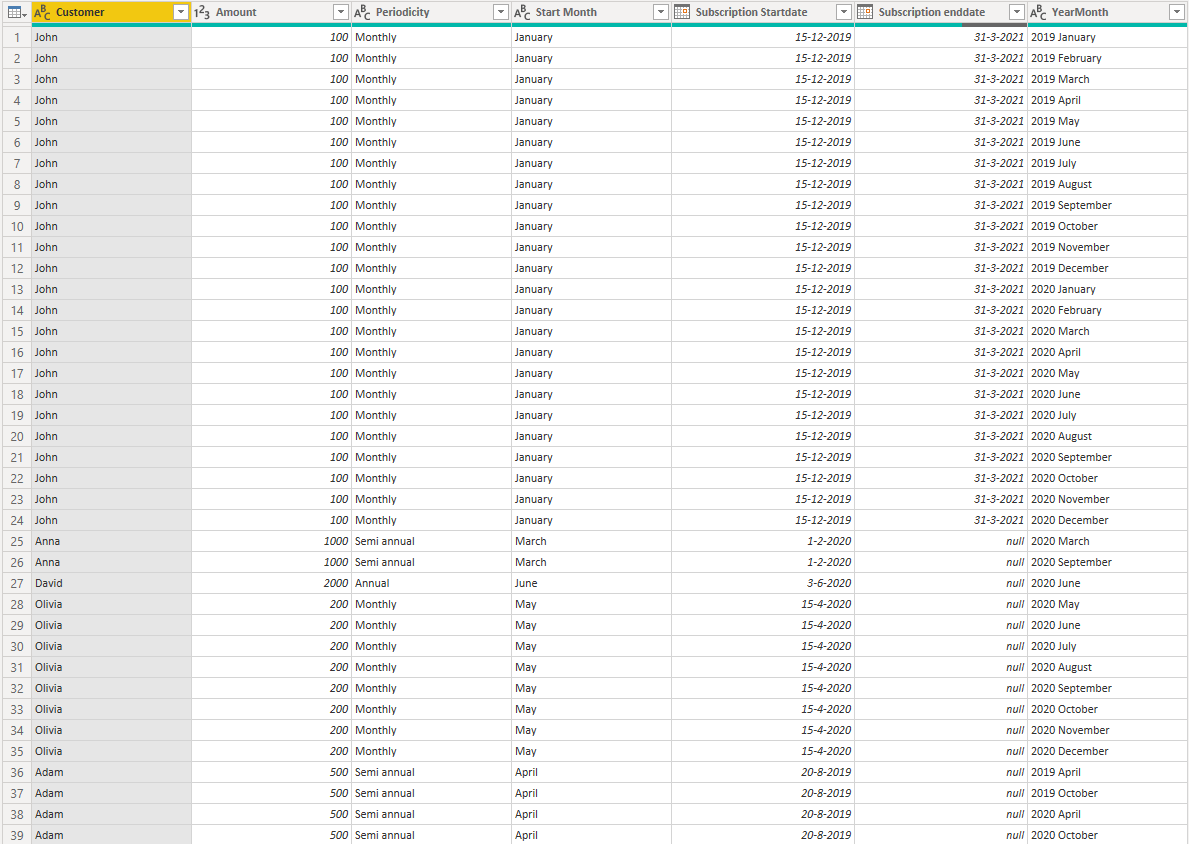
Let me expand on my first example and maybe it will be clearer.
Customers can sign up at any time during the year of course, and they can choose their payment periodicity (annually, monthly etc.) themselves. There are thousands of customers.
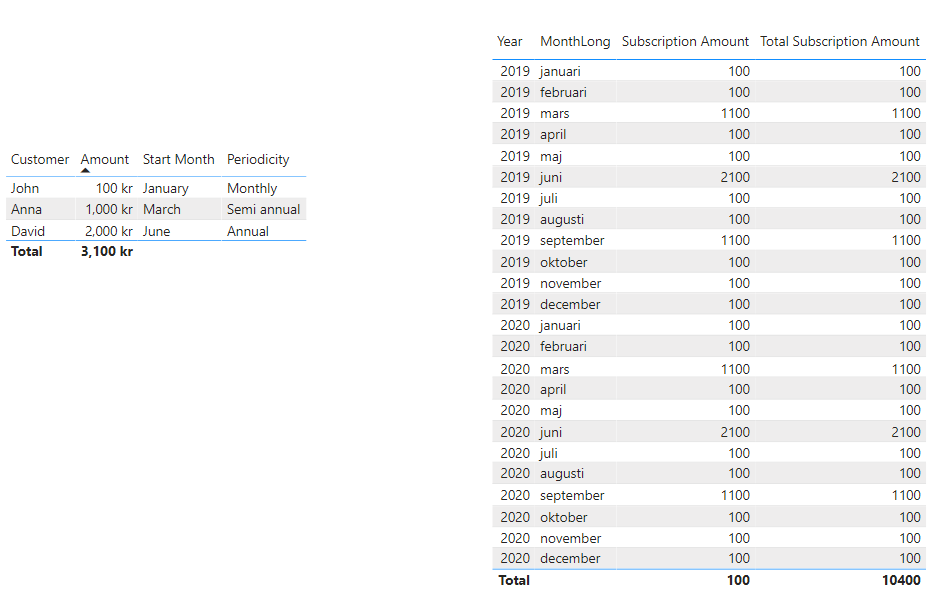
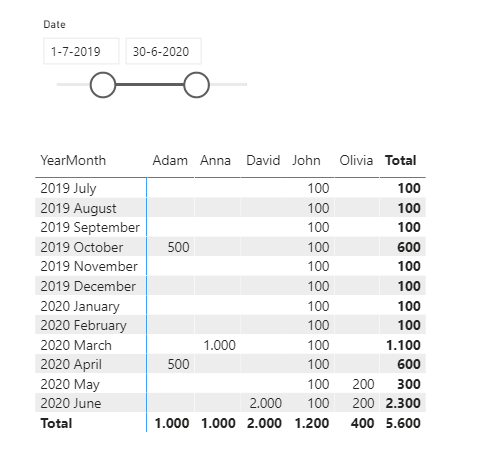
I have also added to the example the subscription start and end date to illustrate the example further but it is not really needed as I have a working way of determining whether a subscription is valid during a specific period. I want the user to be able to use slicer to select the period they want to view this data over and that should only filter on active subscriptions i.e. where the dates in the slicer are within the subscription period. The report only need to contain columns H and I, the rest is just for your reference to understand how the values should be summarized. Also attached a new PBIX with the new sample data.Subscription sample.pbix (186.0 KB)
I created records for all intermittent dates with a custom function called: fxCreateDateRange
IMPORTANT please note that this functions creates dates up to the end of your Date table (CalenderMax) or subscription enddate (endDate) - whatever comes first.
( myStartMonth as number, myStartYear as number, myPeriodID as text, endDate as any ) as list =>
    let
        BufferedInterval = Table.Buffer(Interval),
        maxDate = if endDate <> Date.Type or endDate = null then Date.From(CalenderMax) else List.Min( { Date.From(CalenderMax), Date.From(endDate) }),
        Source = List.Generate(
                () => [x = 1, y = maxDate, z = #date(myStartYear, myStartMonth, 1)],
                each [z] < [y],
                each [x = [x] + 1, y = [y], z = Date.AddMonths( [z],
                    Table.SelectRows( BufferedInterval,
                        (BT) => BT[Periodicity] = myPeriodID ){0}[Interval in Months]
                    )
                ]
            ),
        CreateTable = Table.FromRecords(Source)
    in
        try CreateTable[z] otherwise {}
Hi @Frede, a response on this post has been tagged as “Solution”. If you have a follow question or concern related to this topic, please remove the Solution tag first by clicking the three dots beside Reply and then untick the check box. Also, we’ve recently launched the Enterprise DNA Forum User Experience Survey, please feel free to answer it and give your insights on how we can further improve the Support forum. Thanks!
@Melissa Could you please elaborate and explain in more detail the function created, especially the list.generate part. I have a hard time intetpreting exactly what it does.
I’ve added comments to the M code below
I hope this provides enough detail to help you better understand what is going on in List.Generate
( myStartMonth as number, myStartYear as number, myPeriodID as text, endDate as any ) as list =>
    let
        // load the Interval table into memory
        BufferedInterval = Table.Buffer(Interval),
        // keep the min date from the last date in the date table and the subscription enddate
        maxDate = if endDate <> Date.Type or endDate = null then Date.From(CalenderMax) else List.Min( { Date.From(CalenderMax), Date.From(endDate) }),
        Source = List.Generate(
                // Create an initial Record
                () => [x = 1, y = maxDate, z = #date(myStartYear, myStartMonth, 1)],
                // Define the Condition (Do-While-Loop)
                each [z] < [y],
                // Function that defines a new value for each Record element in that iteration.
                each [x = [x] + 1, y = [y], z = Date.AddMonths( [z],
                    Table.SelectRows( BufferedInterval,
                        (BT) => BT[Periodicity] = myPeriodID ){0}[Interval in Months]
                    )
                ]
            ),
        // Create a table from the generated Record values in List.Generate
        CreateTable = Table.FromRecords(Source)
    in
        // from that table extract the values from column "z", a single column returns a list
        // if this evaluation returns an error an empty list is returned
        try CreateTable[z] otherwise {}
Hi, I’ve run into an unfortunate problem with this solution. The refresh is unfortunately taking too long to complete now and is hitting the 2 hour timeout for the database when published to the service. It works OK when using a copy of the production db on my local machine and refreshing via Power BI Desktop but when published to the service it times out. Before this new query was added the refresh time was around 1 hour but this has put me over the 2 hr timeout limit.
The resulting fact table is basically a copy of another query with additional steps to call this function and expand the rows. I have tried to create a copy of the original query and modify the steps to allow for this function to run but have also tried to reference the first query as the datasource but the refresh both times out in the service. I have also tried reducing the number of rows by removing rows based on dates to no avail. The original table is just 57.000 rows, but as it expands for each month the resulting table will be much larger. Is there anything in the function itself that can be optimized to reduce refresh time? My current code is as follows:
= ( myStartYear as number, myStartMonth as number, myPeriodID as text) as list =>
    let
        BufferedInterval = Table.Buffer(Betalningsintervall),
        endDate = List.Max(Kalender[Datum]),
        startDate = #date(myStartYear, myStartMonth, 1), //start with 1st of motnh when agreement was created
        Source = List.Generate(
                () => [x = 1, y = endDate, z = startDate],
                each [z] < [y],
                each [x = [x] + 1, y = [y], z = Date.AddMonths( [z],
                    Table.SelectRows( BufferedInterval,
                        (BT) => BT[Periodicitet] = myPeriodID ){0}[Månadsintervall]
                    )
                ]
            ),
        CreateTable = Table.FromRecords(Source)
    in
        try CreateTable[z] otherwise {}
The “betalningsintervall” query is the same as Interval in your example file. It’s just 4 rows for monthly, quarterly, semi-annual and annual subscriptions.
The enddate (Max(Kalender[Datum]) is end of yeat for next year as I want to forecast 1 year into the future and 1 year from now is all that’s needed to estimarte revenues from all current subscriptions as they are at least yearly. I could add that date into the function I guess if that might have an effect. I have also reduced the subscription startdate (registreringsdatum) down to subscriptions that was active from 2010-01-01 but this still gives a timeout. The reason for viewing historic dates is that I want to compare what the possible revenue for a specific period was at the time and compare that with the actual revenue and I want to do that for historic dates as well.
Changing the endDate = List.Max(Kalender[Datum]) into something like #date( Date.Year(DateTime.FixedLocalNow())+1, 12, 31) will help a little but isn’t a solution.
And sadly I don’t see room for further improvement.
Can you try reducing the history a year at a time to see how much records you can generate within the refresh limit…
I will try both options and see the results. Will get back with the results.
btw, are functions generally this slow. I mean the result will be only a few million rows.
When limiting the data to 2015 instead of 2010 it finally went through OK. Still takes +2 hrs but I haven’t had any timeouts the last 24 hrs so it seems fine. Thanks for your help.