I have created a dashboard on Excel and used a Year slicer to dynamically change charts. But 1st chart in my dashboard is not changing as per the slicer. I have created a Date Table in Excel data modeling and mapped date column from date table to various date columns in other tables. DATASET-XL.xlsx (597.7 KB)
The problem is with slicing data in 1st Sheet, Scheme_Details. Can anyone check my sheets, data model and relationships and find out why slicer is not getting applied on 1st chart that uses data from Scheme_Details sheet?
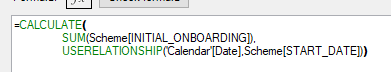
your date table has an inactive relationship to the Scheme table, so filters on the date table will only impact the Scheme table if you ‘turn on’ that relationship via a measure.
I notice that you have done that in your Total Sales calculation:
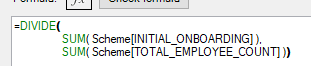
You need to repeat that logic for your Onboard % calculation:
You may want to take a look at Sam’s Ultimate Beginner Guide to DAX series for some additional tips.
I have already created Total Sales in Excel data view using USERELATIONSHIP and used that measure in Excel sheet using CubeValue. Still the slicer is not filtering based on selection. I am not able to figure out the problem. Can you kindly check it once again?
None of the visuals on your report appear to be using the Total Sales measure.
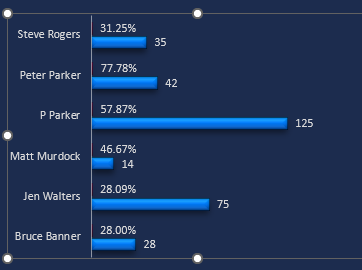
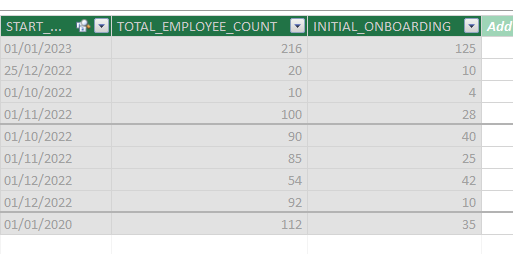
For the chart that is not filtering - which I see to be this one:
you are using the Onboarding % measure which does NOT call the Total sales measure (see my screenshot above):
looking at your model more fully - I see that you are using a LOT of cases where you just pull in the column from the table, rather than a measure. This is not recommended in Power Query solutions (even when you’re working in Excel). take a look at the updated file I have provided. NOTE: I had to add a new Date field to your calendar (a date/time field isn’t going to filter a date field).
I have also cleaned up the relationships between your tables - from what I was seeing in your dataset, it didn’t SEEM to be necessary to directly connect the Calendar to every table in the report.
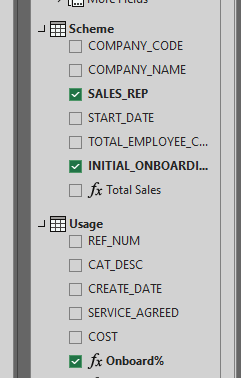
I hid the columns that are either handled by a measure (such as the employee count) or are the ‘many’ end of a connection. This is a good practice to avoid accidentally using those columns in a visual and ending up with incorrect results.
Generally in my own models, anything that is a number that can be summed - I create a measure for and hide the original column. I also hide columns that are used for sorting (in a PBIX file you would have to add a sort column to have Months not sort alphabetically). And I always hide connection fields (in the screenshot you have shown I hid the star date because it is filtered by the calendar).
Just following up if the response above help you solve your inquiry.
If it did, please mark his answer as the SOLUTION.
We’ve noticed that no response was received from you on the post above. In case there won’t be any activity on it in the next few days, we’ll be tagging this post as Solved.