Events in Progress

Use the Events in Progress pattern to return the records that are active (i.e., between two dates) during a given time period. Use Inactive relationships between the 2 date fields in the Fact table and main field in the Dates table.

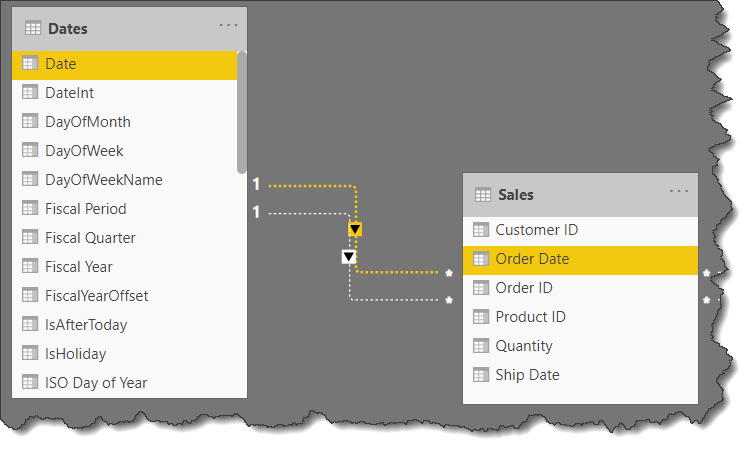
For example, you may want to know the number of sales orders that have been ordered but not shipped in a certain time period. So, first setup 2 Inactive relationships in your data model between:

Using a date slicer, you can then calculate the Total Sales “in progress” during the selected period using the DAX formula:

To get the value of the orders in progress:

Sales in Progress = 
// DAX PATTERN NAME: Events in Progress
// NOTES: Use 2 inactive relationships between the FACT table and the DATE table along with a FILTER for each DATE
// TIP: Select the text to change, then use CRTL + SHIFT + L to rename ALL occurrences at once
// TIP: Use CRTL + mouse scroll wheel to zoom the text size
CALCULATE(
    SUMX(
        Sales,
        Sales[Quantity] * RELATED( Products[Unit Price] )
    ),
    // replace [SUMX] calculation as necessary
    FILTER(
        VALUES( Sales[Order Date] ),
            Sales[Order Date] <= MAX( Dates[Date] )
    ),
    // replace Sales[Order Date] with the date representing the "start" of the "period"; replace Dates[Date] with the name of the main [Date] field in the [Dates] table
    FILTER(
        VALUES( Sales[Ship Date] ),
            Sales[Ship Date] >= MAX( Dates[Date] )
    ) // replace Sales[Ship Date] with the date representing the "end" of the "period"; replace Dates[Date] with the name of the main [Date] field in the[Dates] table
)

(The first FILTER creates a table of sales that were ordered before the end of the selected period, while the second FILTER creates a table of the sales that have not yet been shipped as of the end of the selected date; those sales records that meet both criteria are the ones used in the SUM.)

NOTE: adjust the conditionals as necessary (e.g., “>= MAX” portion of “Sales[Ship Date] >= MAX( Dates[Date] )” to suit your definition of an active record (e.g., if an sale is only considered shipped after the ship date as opposed to on the ship date, change the “>=” to “>”, etc.).

Similarly, to get the number of orders in progress:

Orders in Progress = 
// DAX PATTERN NAME: Events in Progress
// NOTES: Use 2 inactive relationships between the FACT table and the DATE table along with a FILTER for each DATE
// TIP: Select the text to change, then use CRTL + SHIFT + L to rename ALL occurrences at once
// TIP: Use CRTL + mouse scroll wheel to zoom the text size
CALCULATE(
    COUNTROWS( Sales ),
    FILTER(
        VALUES( Sales[Order Date] ),
            Sales[Order Date] <= MAX( Dates[Date] )
    ),
    // replace Sales[Order Date] with the date representing the "start" of the "period"; replace Dates[Date] with the name of the main [Date] field in the [Dates] table
    FILTER(
        VALUES( Sales[Ship Date] ),
            Sales[Ship Date] >= MAX( Dates[Date] )
    ) // replace Sales[Ship Date] with the date representing the "end" of the "period"; replace Dates[Date] with the name of the main [Date] field in the[Dates] table
)

NOTE: you’ll need to explicitly state the relationship to use in your measures via USERELATIONSHIP. For example, the [Total Sales] measure would be as follows:

Total Sales =
CALCULATE(
    SUMX(
        Sales,
        Sales[Quantity] * RELATED( Products[Unit Price] )
    ),
    USERELATIONSHIP( Dates[Date], Sales[Order Date] )
)

TIP: don’t use a column or measure that is outside of the main (fact) table; rather, use an aggregation (e.g., SUM) of a main (fact) table column or an iteration (e.g., SUMX) of related (lookup) table columns

4 Likes

Just adding some keywords to make this pattern easier to locate via forum search:
DAX pattern, events in progress, between 2 dates, in period

1 Like

Related Content:

Below are a few examples of issues related to the Events in Progress DAX Pattern from the eDNA resources.

Enterprise DNA Forum (Search):

Enterprise DNA TV (YouTube):

Total Number Of Staff Over Time

How To Manage Multiple Date Calculations In Your Fact Tables - Advanced Power BI

Hi All,
two questions concerning this technique.

#1
I wanted to use this pattern to calculate the number of products in the warranty at the end of the month by months and not by days and it looks like MIN ( Dates[Date] ) for warranty end date (in the example above equal to the ship date) gives the wrong results. If I use MAX instead MIN , the results are the same as in excel.
MIN (date) returns the first day in the month, MAX (date) the last day, so the number of products in the warranty is in this case are bigger as the warranty end may fall somewhere in between. Does make it sense?

#2
Is it possible to calculate rolling total or moving average of Events in Progress with inactive relationships between the dates?
For my warranty report I need also the 12 months rolling average of the number of product under warranty at the end of the month. It looks like Moving Average pattern and 12M Rolling Total do not work properly in this case or they have to be somehow adjusted.

the 12 months average of MW u/Warr in the table below should give 5465
Any tips how to solve this problem?

Thanks in advance
Regards

image

Hi @Maisy.

I’m glad you’re finding the Events in Progress pattern helpful. Regarding your question #1, ensure you’re using a [Dates] table with a [Month Ending] column like eDNA’s Extended Date Table.

if you then use a visual with the month ending date, you can use the Events in Progress pattern without modification.

I don’t have any immediate thoughts on your 2nd question, but will think on it a bit.

Hope it helps.
Greg
eDNA Forum - Events in Progress - Warranties.pbix (78.1 KB)

Hi Greg,

thanks for your answer, I have tried with the month ending date, but still have the same difference.
Meanwhile I had a closer look to the example you have attached.
From the upper table with the data - only products 3, 4 and 7 are under warranty on 31/05/2020 (amount of product under warranty = 3) and five products (nos. 3, 4, 6, 7 and 10) are under warranty on 30/04/2020 .
The measure Warranties in Progress (lower table) gives however 5 and 7 products u/ warranty respectively. Could you please check?

thanks and best regards
Hanna

Hi @Maisy. Oops … typo … the last FILTER in the [Warranties in Progress] measure should use MAX, not MIN to filter for warranties expiring after the month end date.
Sorry for the trouble.
Greg

Hi Greg,

thanks, all clear.

still open #2 (12 mths rolling total etc. for events in progress).
any tips would be highly appreciated…

best regards
Hanna

Hi @Maisy.

Sorry to take so long to get back to you. Canada Day and that pesky day job conspired to delay me until now.

#2(a) No, you need to have an active relationship with a date table that marked as such in order for the Power BI time intelligence DAX measures to work properly.

#2(b) I don’t think there’s any issue per se with the Moving Average pattern, it just can give wierd results when there’s not a full period (in your case, 12 months) of historical data before each date. A quick comparison with Excel produces slightly different numbers, and perhaps others have some experience as to why.

I’m not sure to which [MW u/Warr] row you are referring to when you say the value should be 5465: do you mean the value on the “Total” line (6093)? If so, this sounds like a case of the “incorrect total” issue that arises when you take a display the simple total of a measure that uses an iterative, or “X” function. A quick search of the eDNA site returned the following links which explain this situation more fully.

If you still need help after that, please post a PBIX, a sample dataset in Excel, and a screen shot of the expected outcome in Excel and I’ll dive in more deeply.

Hope this helps.
Greg

Hi Greg,

Thank you very much for your answer, I really appreciate your time.
I am very sorry I was not precise enough.
I need 12 m rolling monthly average (equal to moving average 12 months, I believe) from MW (and the number of products as well) under warranty calculated at the end of month.
The rolling measure does not work well as it gives the same results as the MW u/Warr measure.
I guess it is so because no active relationships with the Dates table. (if it is not a pure coincidence why to bother with more complicated formula for events in progress?).
The ‘should’ value 5465 I have mentioned it is 12 months rolling monthly average of MW at the end of May 20 (Jun19-May20 average from the data in the table I have pasted in the previous post)
The moving average measure gives also wrong results.

I have attached pbix and xlsx for your reference. I hope xlsx is clear, DB_No stands for product ID, G3_… and G4_… are the dates of interest. The second sheet contains the expected results (historical, as per excel calc). They may slightly differ from the results from xlsx due to some updates in G3 and G4 dates.

I have an impression that no relationship with Dates table makes troubles.
My attempts with USERELATIONSHIP failed, however I do not exclude I do sth wrong.

Is there any possibility e.g. to transfer columns Month Ending and MW u/Warr into a new fact table and connect it with Dates table, in this case rolling and MA measures may work. Or?

Best regards
Hanna

EB2_data.xlsx (79.0 KB)
200704_CoPQ_rev2.pbix (607.0 KB)

Hi @Maisy. You won’t be able to use any of the Power BI time intelligence functions without a [Dates] table that is marked as such. Please mark your [Dates] table as a Date table.

Mark as Date table

Before I can dive deeply into why the “should” value of 5465 as shown in your Excel file is not showing-up, can you please let me know which set of numbers you are trying to match? The numbers for [End u/Warr] and [MW u/Warr] do not match between your PBIX and your Excel (e.g., for month ending May 31, 2020, should [Eng u/Warr] be 292 or 312?)

PBIX:


Excel:

Greg

Hi Greg,

sorry for my late answer, I had some technical problems.

Trying to find the difference you have pointed out I have reviewed what I had sent you.
There is indeed a difference between the ‘should’ data in the second sheet and the excel data table/pbix.
I have reduced the original excel to order date 2015+, but in the original file there are several additional products ordered in 2014 , that are still under warranty. Sorry, my oversight. It is very misleading. Please forget the ‘should’ values.

[Eng u/Warr] is correct but not the rolling measures.
e.g. 12 months rolling average calculated in excel is @ 31/05/2020 = 221 , in pbix is the same as Eng u/Warr. I have marked the Date table in pbix as you recommend, but no change in results.

All these exercises are because our main warranty KPI is kW/CHF (12 months rolling average of kilowatts of engines under warranty divided by 12 months rolling warranty costs).

best regards from Switzerland
Hanna

Hi @Maisy.

I suspect this is another instance of where there are many ways to accomplish the same thing in Power BI / DAX, but in any event, here’s one posible solution to your problem: if you create DAX tables for “Eng u/Warr” and “MW u/Warr” summarizing by [MonthEnding], you can then create simple measures to give the same (rounded) results as Excel. (I suspect your issue was that the “Moving Average” pattern calculated the average for each day in the past year rather than the average of the monthly values.) So, for “Eng u/Warr”, I created a DAX table as:

Eng under Warranty Summary Table = 
SUMMARIZECOLUMNS(
    Dates[MonthEnding],  // create summary of the month ending dates
    "Eng under Warr", [Eng u/Warr] 
    )

Then I created a new measure as:

Eng u/Warr 12M Rolling Average 2 = 
VAR EndDate = MAX( Dates[Date] ) 
RETURN CALCULATE(
    AVERAGE('Eng under Warranty Summary Table'[Eng under Warr] ),
    TOPN(
        12,
        FILTER(
          'Eng under Warranty Summary Table',
          'Eng under Warranty Summary Table'[MonthEnding] <= EndDate ),
        'Eng under Warranty Summary Table'[MonthEnding],
        DESC
    )
)

The results for the [Eng u/Warr 12M Rolling Average 2] measure now match those computed in Excel. I did “MW u/Warr” as well but please check the numbers are what you expect.

Hope this helps.
Greg
eDNA Forum - Events in Progress - Warranties 2.pbix (527.7 KB)

Hi Greg,

thanks a lot, I’ve spent some time analysing how you have done it and checking against excel results. It seems the applied measures for 12 mths rolling (all products together) works well, chapeaux bas.

However my attempts to drill down the 12 mths rolling average into products were not so successful. Product filter (slicer) works only with Eng u/Warr measure but not with the Eng u/Warr 12M Rolling Average 2. Also the adding an additional column to the Eng under Warranty Summary Table brings nothing. Do you think it is possible to get the 12M rolling average by product?
Regards
Hanna

Hi @Maisy,

Can you test if iterating over a virtual table instead of summary table helps, thanks.

Eng u/Warr 12M Rolling Average v3 = 
VAR EndDate = MAX( Dates[Date] ) 
VAR vTable = ADDCOLUMNS( SUMMARIZE( ALL( Dates ), Dates[MonthEnding] ), "@Eng under Warr", [Eng u/Warr] )
RETURN

    AVERAGEX(
        TOPN(
            12,
            FILTER( vTable, [MonthEnding] <= EndDate ),
            [MonthEnding],
            DESC
        ), [@Eng under Warr]
    )

and this one as well

MW u/Warr 12M Rolling Average v3 = 
VAR EndDate = MAX( Dates[Date] ) 
VAR vTable = ADDCOLUMNS( SUMMARIZE( ALL( Dates ), Dates[MonthEnding] ), "@MW u/Warr", [MW u/Warr] )
RETURN

    AVERAGEX(
        TOPN(
            12,
            FILTER( vTable, [MonthEnding] <= EndDate ),
            [MonthEnding],
            DESC
        ), [@MW u/Warr]
    )

Hi Melissa,

many, many thanks, it seems to be the right direction. I have made several exercises and got the results as expected.
I do not know yet how it exactly works, but it works!
Could you please advise which training module covers the virtual tables technique?
Rgds
Hanna

1 Like

Glad to hear that was helpful. :+1:
So this works because of data lineage… read up on it here.

.
And here’s some content to get you started with Virtual Tables.

.

And look through the “Learning Summit Series” you’ll find some there as well, I believe.

1 Like