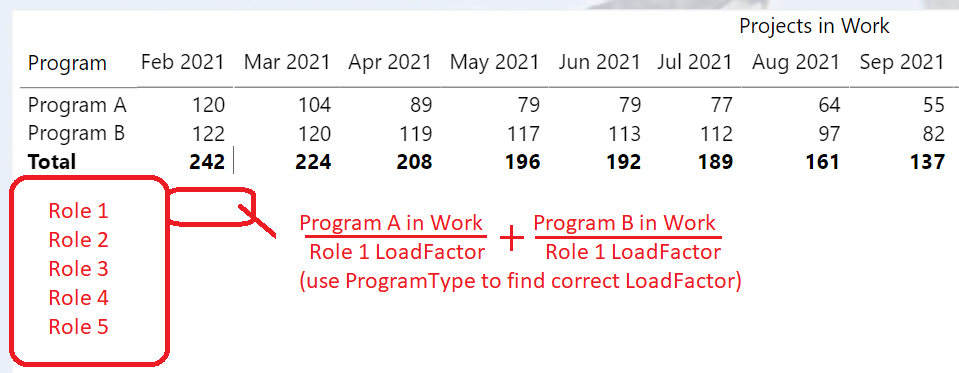
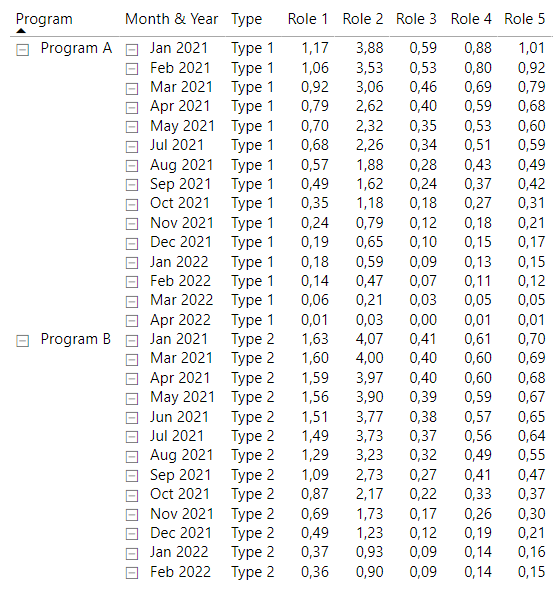
Create a view of workload based on in-work projects and Roles. See the figure below that uses the Matrix visual to show events in progress. (visual1.png)
Projects in work uses an Events in Progress – End of Period pattern to calculate.
The Role resources needed are based on the number of active (in work) projects using Role Load factor:
Divide the # of projects in work of a Type by the Role Load Factor for that type and SUM for all the types for this period.
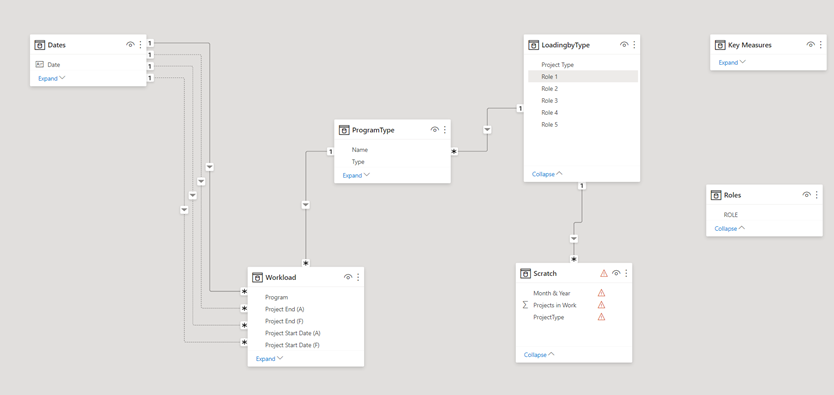
The LoadingbyType table contains the load factors for each role and project type. These are maintained by the resource managers and normally loaded from a Sharepoint file so this can be updated.
The ProgramType table maps programs to type. This is also maintained online and the Project Type will eventually be a project attribute we can get from the project management tool.
The Workload table is typically pulled from a project management tool (I created a Status report of two programs to use for this example and merged in the type) and contains the Project ID, Start/End dates (actual and forecast) and project type.
Problem Statement
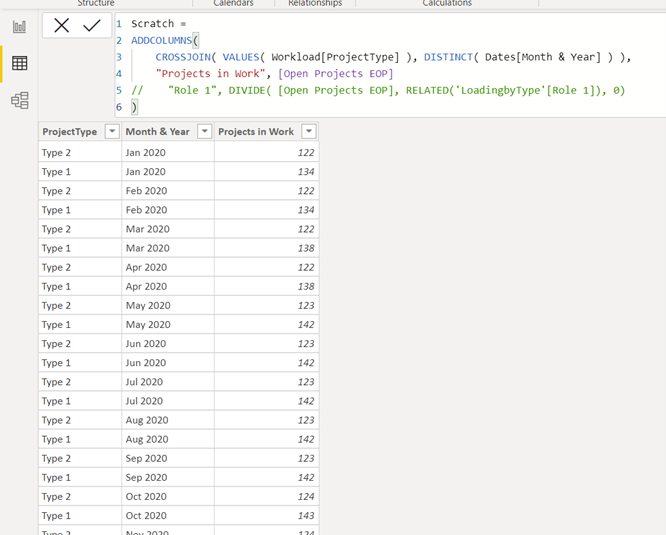
I am stuck on how to bring the roles into a view that includes the events in progress. I want to add the ROLEs with the Load Calculation to the view above and feel like I am missing something – like if I just got the tables into the correct shape it would be easy to show.
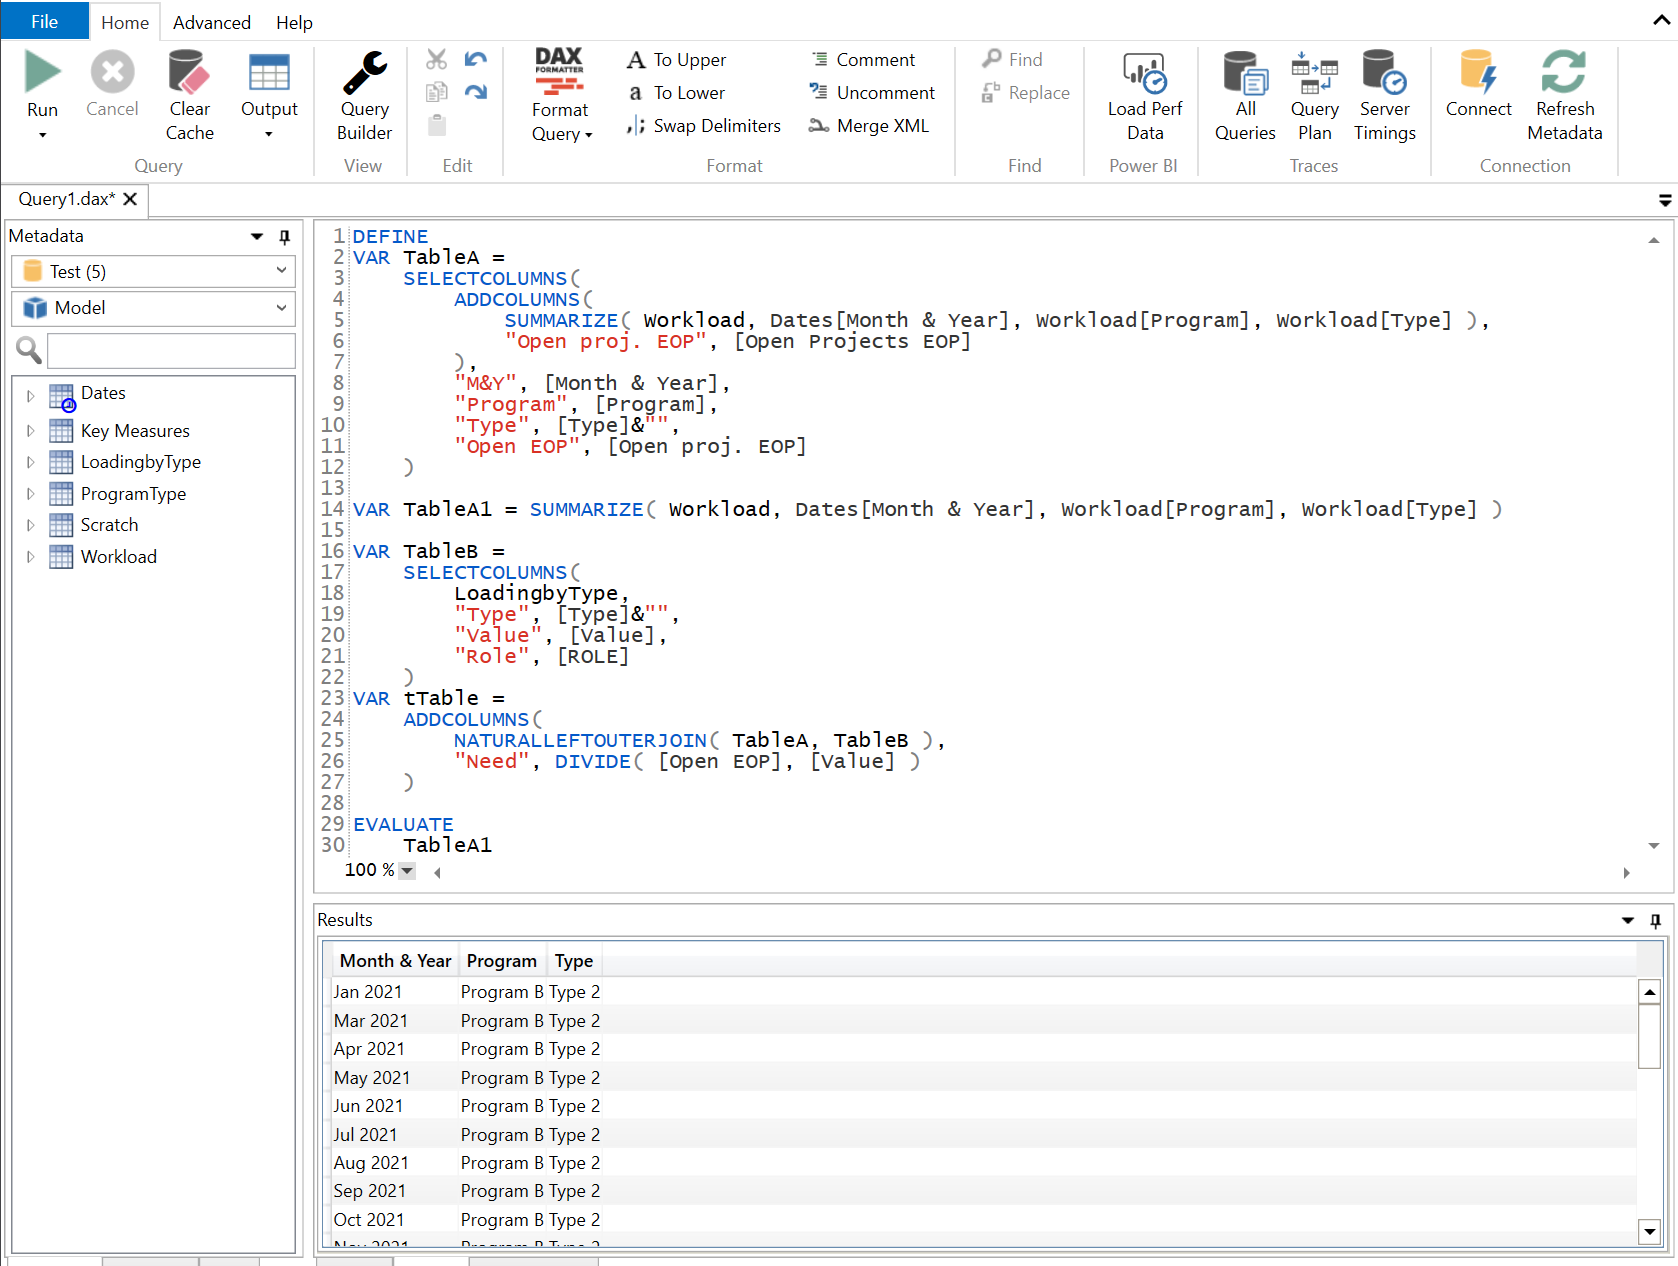
of course, I can cheat and export the data from the Projects in work matrix and then import this back into the model - merge with type and loading factors and calculate Role Need (shown on scratch tab). But of course what I need is to find a way to model this and use measures to calculate need. Sigh. Test.pbix (3.8 MB)
Thank-you, Melissa! You really are a wizard with this and that measure is not something I would have been able to craft. Filters work for Program and Type as well. Cool. (Still lots to learn here for me.)
Great solution. Very weird to see two DAX NATURALLEFTOUTERJOIN lineage break solutions in the same week. That’s one that I keep in Analyst Hub because it comes up so seldom, at least for me…
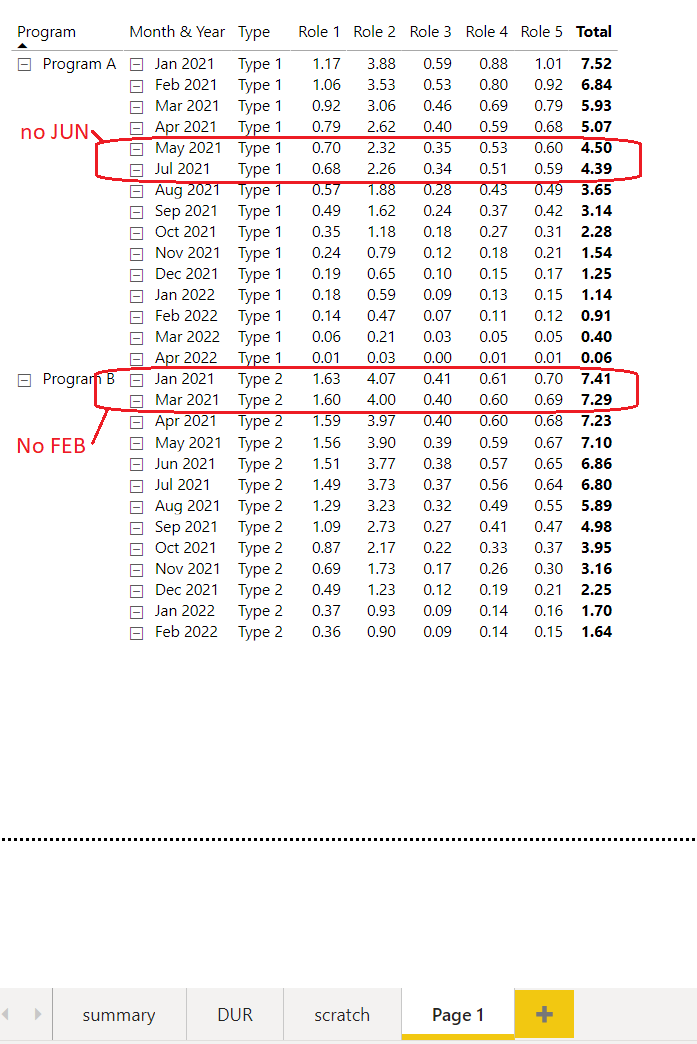
Well this is a bit embarrassing but the SUMMARIZE function returns a table with only rows that have a delivery. So Program A had no JUN (projects in work stayed the same) and Project B had not FEB
And I cannot seem to find a way to include those months.
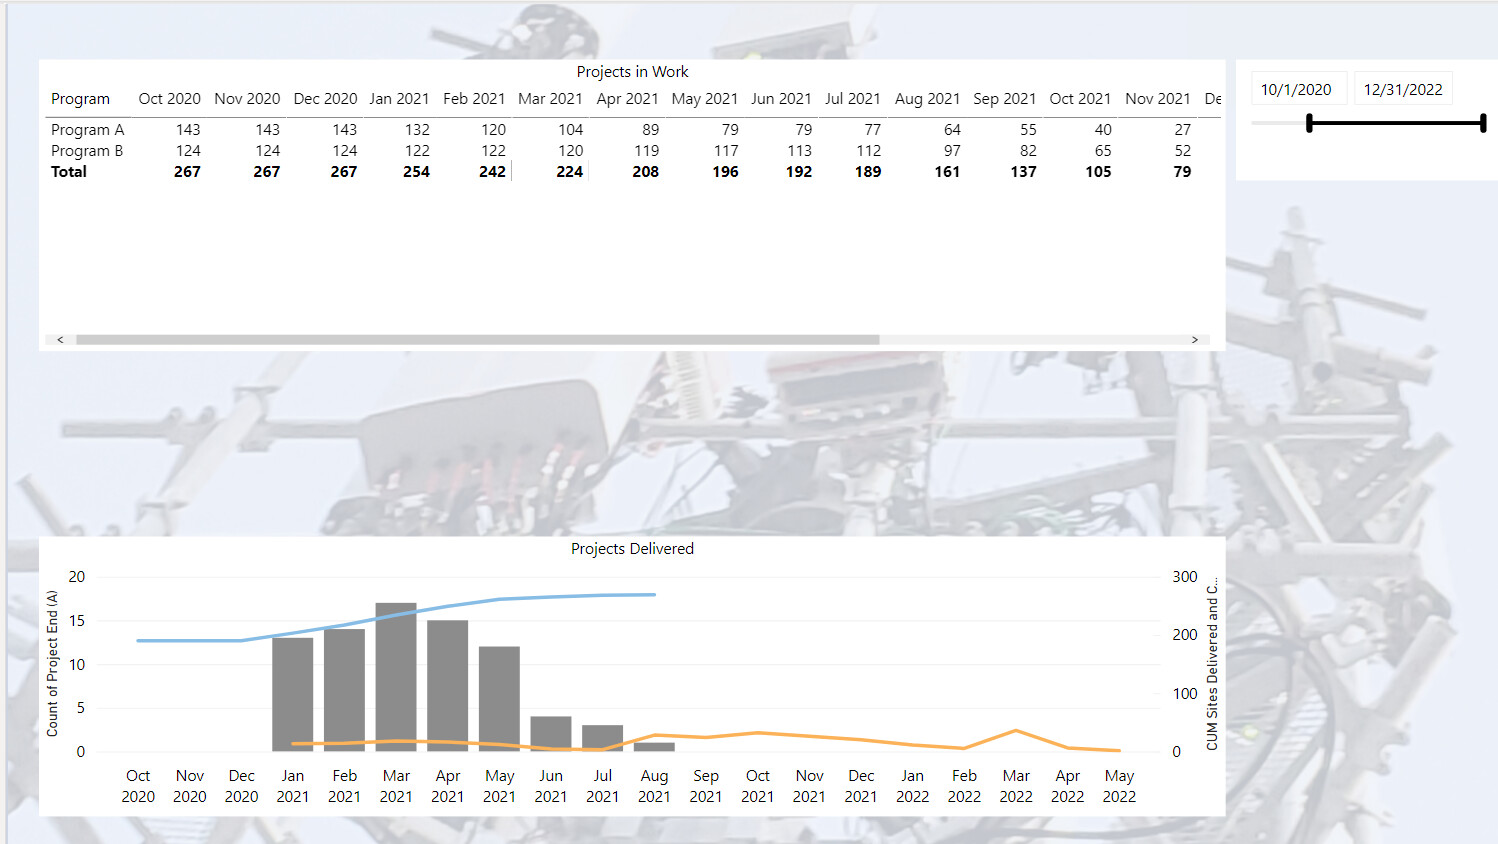
OR the leading months with no delivery - so the Program A projects started in 2019 and were active until the first delivery in Jan 2021… result table should have the Roles committed from late 2019. If I select a date range from 1-Oct-2020 this is evident on the Summary tab where the delivered line is flat.
I am able to expand the workload table to add a row for every month a project is open - and creating a month end column for each of these rows. Want to get this to summarize down to each Month & Year with the count of projects active that month by program and type. Test (6).pbix (3.7 MB)
Modified the measures for Open All and Open EOP but still not able to show months prior to Jan2021 with these calculations so cannot get to the Need for those months.
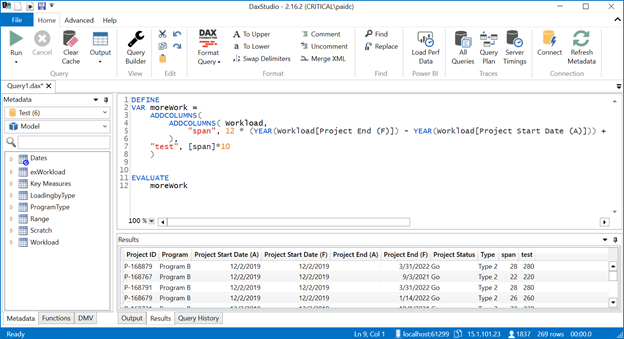
While this expanded Workload table works, it would be better to expand it as a virtual table - the added rows are not used for anything but the load calcs. I am able to add the RANGE column using ADDCOLUMNS and then can access that column for a further calculation. Test (7).pbix (3.7 MB)
But cannot find an equivalent DAX expression to the
“MonthList”, each List.Numbers( 1, [Range] )
in PowerQuery. And if I need to ‘nest’ each ADDCOLUMN to access the result for the next column this will look really ugly. Any suggestions on how this might be implemented as a virtual table?