Currently I am struggling with dynamically calculating the aged accounts receivables on a selected date, as similar on the Power BI Showcase Accounts Receivable Insights module. With the difference that I am interested in the historic value, not the forecast.
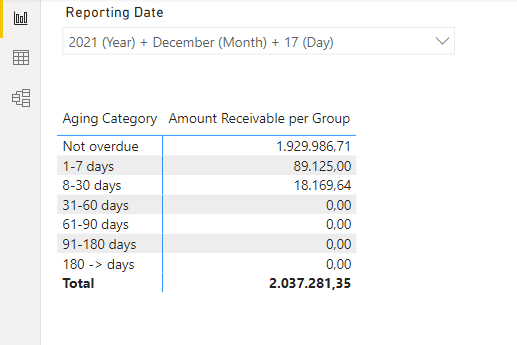
With the above mentioned module, I managed to correctly calculate the amounts as per December 17th:
But it requires an inactive relationship between my fact table and date table, which is not wanted. Also, I noticed that if the amount of transactions increase, the performance decrease tremendously.
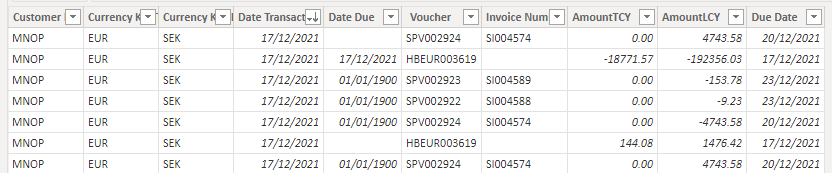
The fact table consists out of all the transactions made on the customer’s account. It contains Invoices, Payments, Currency Revaluations and Credit Notes. The sum of all those transactions up to a selected date is the amount outstanding on that date.
Via another post somewhere on the internet I managed to calculate the amount outstanding while keeping the relationship active using the CROSSFILTER function, but I do not seem to be able to get this working anymore.
Could somebody help me dynamically calculating and grouping accounts receivable amounts while keeping the relationship between my fact table and date table active? Or provide me with some other smart and efficient way to achieve this? Attached is a sample Power BI file with the currently working solution.
Thanks @EnterpriseDNA for the following up. I’d already found these post in my initial search, they all come close to what I want/expect, but not fully.
This post is very similar to what I am trying to achieve. The issue here is that it is using the same method of using an inactive relationship which is undesired. The performance of the sample solution created is a bit slow. Also, the level of granularity is different. In my model it is on the individual transaction, an invoice is paid when the amount outstanding is 0, thus not having a payment date. As used in this example.
Again, very similar to what I am trying to achieve. But here the buckets are not dynamically grouped, for each bucket there is a separate measure, which, as mentioned in this topic, is very slow.
This one comes close, but is almost the same as the example created by the EnterpriseDNA showcase.
As I mentioned in my opening post, I managed to get the dynamically grouping working. The question is did some one manage to get the dynamically grouping working based on a large dataset with performance in mind? In my reports everything is loading fast, except the dynamically grouping.
I am not sure why you need payment information and why you have developed the calculated column “Due Date” in your fact table, are you trying to calculate “Due date” backwards in the time ?
My first thought would be trying to upload only the non paid invoices (not matched invoice amounts with payments), to significantly (?) reduce the fact-table, so increasing the performance, is that possible ?
And secondly add a date-version per each upload in the fact-table, and use this for overdue calculations, instead of the date from the date table. If daily aging movements are required, the fact-table data should be refreshed on a daily base.
Possibly the measures “_dateDue”, “_dateSelected”, “Days Overdue” and “Amount Receivable per Group” performs faster if based upon a part of the data, when being selected on a date-version, instead of selecting from all the data.
As I am not familiar with the data, and my thoughts proposes a different methodology, (which I would expect to be faster), could you give a reaction ?
Kind regards, met vriendelijke groeten, Jan van der Wind
The reason why we need Due Date is that we determine the Overdue based upon the difference between the Due Date and the selected Reporting Date. The fact table contains multiple transaction types, where only the Invoices have actual Due Dates, for the other transaction types we use the calculated column.
The thing is that an Invoice can have multiple payments. Thus if a different reporting date has been selected, an Invoice could be paid, partially pad or open. In short, the open Invoice amount is the sum of all transactions up to and including a particular moment. This is what makes the report flexible and dynamic.
I am not really sure if I understand what you are saying here. The data is “hot”, meaning that records can be deleted, updated and inserted. Therefore I do not think that a daily refresh is the way to go.
Really appreciate your help and your different viewpoints!
After thinking a bit more about the data model, I thought of a manner reducing the number of records being returned. All transactions of Invoices that result in a total of 0 (= Invoice has been issued and fully paid), with a date earlier that the Reporting Date, could be ignored.
I try to achieve this with the following calculated column:
And using it in my CALCULATE function. However, this is not working as expected. The table is still loading slowly. Attached is another version with this setup in place. Hoping that someone could point me in the right direction.
Thanks for the extensive reply. (it would be easier to speak instead of write here)
Try to do this in Power Query or even by changing your source query, that will reduce your fact table and increase performance.
I think that with an adjusted source query (without fully paid invoices), you do not need the upmost DAX formulas as presented.
Therefore I would like to have a better understanding of the data input process:
do you use the Account receivable subledger as a source ?
how often do you upload the data, on a daily or weekly base ?
do you ADD new subledger data to the existing Power BI data ?
why are payments separate lines in the upload, could you not generate a net balance per voucher, excluding the settled vouchers, what is a überhaupt voucher ?
Example of current AR data with a settled voucher:
My concept/idea is: add on a daily (or weekly) base new NET AR data(without settled vouchers) from the source system, include an upload date and determine overdue categories, based upon difference of transaction date and the upload date (line by line available).
Hereby only a very few DAX formulas needed, but question if this is possible within live environment.
Hi @Benjamin, we’ve noticed that no response has been received from you since 4 days ago. We just want to check if you still need further help with this post? In case there won’t be any activity on it in the next few days, we’ll be tagging this post as Solved.
I’ve tested this in Power Query according to this article and it worked, but the performance was rubbish. However, I’ve adjusted the source view, including a calculated settled date, the date where all transactions add up to 0. This alows me to filter out much records and speeds up the visualizations a bit.
It now becomes clear that the amount of records wat not really the slowest part, it seems to be the dynamically grouping in bins.
We’ve scheduled a consultancy session with the @EnterpriseDNA team to look into this, as we are trying to do alomst exactly the same as they did in the showcase. Once we have a final solution I will update this post with the outcome.
In the meantime to answer your posts:
This is correct. The data comes from our ERP system into our datawarehouse.
The data is being uploaded on an hourly base. But we are acceptable with a daily update.
Yes we do.
Because we need all transactions to determine the amount on a particular date. If there are 5 transactions within an invoice (thus 5 vouchers), and due to the selected reporting date only 4 should be included, the sum of those 4 should be the balance at that particular date. I’m note sure what a überhaupt voucher is.
Last week we had a meeting with the awesome team of @EnterpriseDNA who helped us with tweaking the DAX code to speed up the visualizations.
Together with them we came up with a solution of creating a filtered table based upon the criteria we needed. For who it needs, the DAX code is as following:
Massive thanks for providing this solution @Benjamin. Adding a date when the transaction was completed upstream and using the filtered table code you provided improved our performance tremendously! We went from >30 seconds for 18 months of data down to <10 seconds for almost 4 years worth of data.