I’m having an interesting issue that I can’t solve. I am trying to get a breakdown of AR aging using due date and sort by selected date.
Inside the data there are three dates:
Invoice Date
Due Date
Payment Date
If payment date is blank, then the invoice is unpaid. However, there are a few data errors that I have to remove inside the formula, that that is the following: If payment date is blank and amount paid is > 0, then the invoice is paid. You will see this inside the Due Date measure.
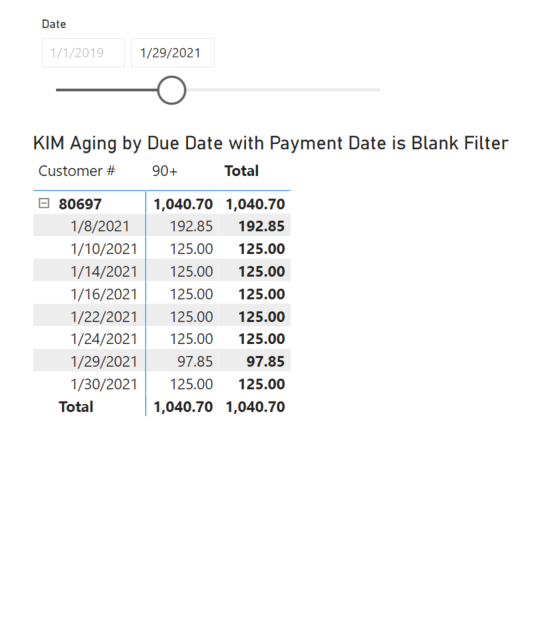
Here is where I’m having an issue. On Page 1, I filtered down to one customer number for comparison. I have 2 tables, the table on the left is using the dynamic formula, that should update the numbers based on the selected date, then I have the table on the right, this table I am only looking at invoices where the payment date is blank.
Both table show the SAME invoices and invoices amounts BUT the totals are different. If I export the underlying data, from both tables, the totals match.
I’m trying to figure out why the totals on the left table don’t sum up properly.
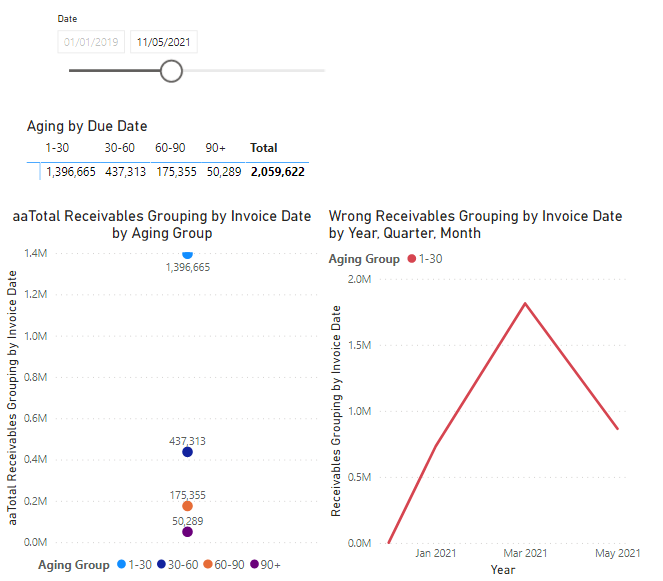
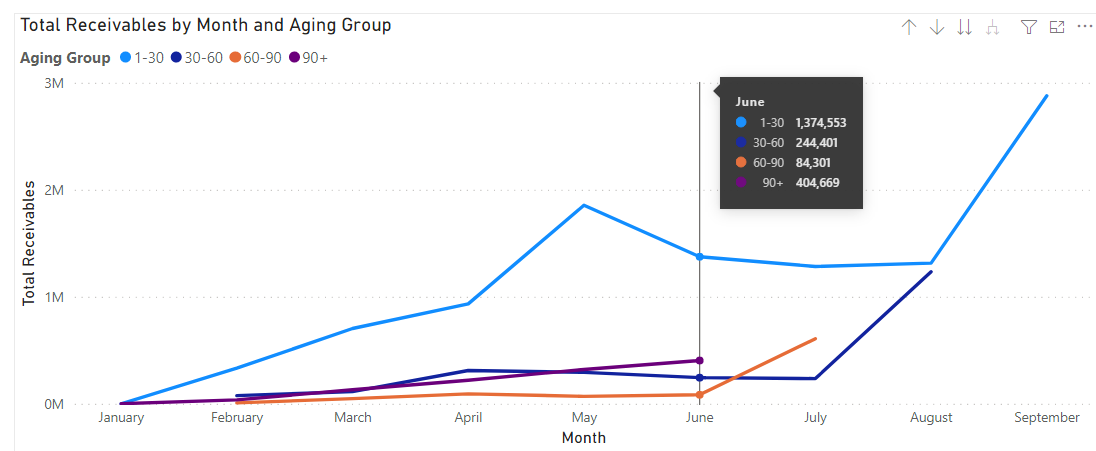
In addition, on the Graph tab, I am trying to build a line graph that shows the trend for the aging groups. It is only giving me the trend for group 0-30, and the totals are not correct.
Hi Mark,
If this was my model, I would use Power Query and minimise the use of DAX. If you can include your AR Aging Sample Data.xlsx file I could have a play with it.
I am still very much a beginner with PBI, unfortunately, DAX is something this still over my head. I do look forward to digging in on that side. I have attached the sample data, and I appreciate your time on it.
Hi Mark,
I have used Power Query, Conditional column to determine if the invoice is unpaid based on the logic you stated above. I then create two measures, Unpaid invoices and Unpaid Invoices by Aging Groups.
My measure for Aging Groups follows the example by Sam.
Have a look at the attached file, in page 1, table on right. Is this working how your expect? AR Aging Example Kim.pbix (996.6 KB)
Thank you for this. I was playing around with the date slicer, and it does not seem to be filtering the invoices properly. When I filter down to 1/29/2021, it is showing invoices with dates in 01/2021 as 90 days old. Based on the selected date, these should be in the 1-30 age group.
if you want to make it dynamic, i think you would need to use dax measure with selected value, starting to get tricky with dynamic age range as well, I think this one is getting beyond my dax capabilities…
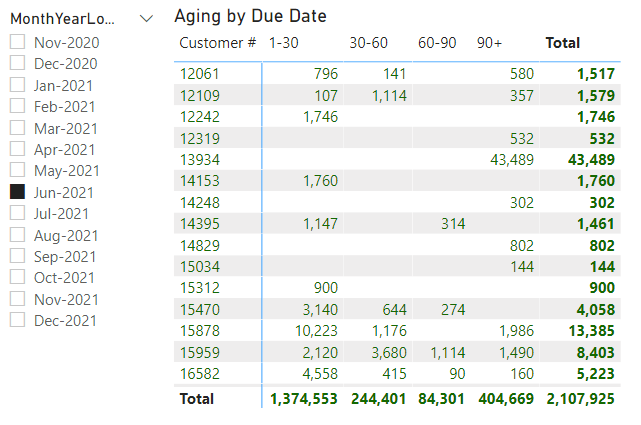
Inside the model, I have a measure titled Total Invoices before date, this measure is where I’m utilizing the selected date feature of DAX.
Inside the Matrix title Aging by due date, it is updating the invoices properly based on the selected date however, it is not totaling them properly. In addition, on the Graph tab, I am not able to see trend lines for all the aging groups. Something is not allowing it to calculate properly.
I feel like I’m close but there is one thing I’m missing.
I have been quite busy with work so not much time to look at this again. I would be interested to see if anyone else can solve it. by using the measure Unpaid Invoices, the DAX can be simplified a little.
Incorrect totals, with this kind of calculations, is a known problem, as the context at the total needs to be derived/calculated from the row context of each individual line in the report.
The measure as stated below can be used:
aaTotal Receivables Grouping by Invoice Date =
    SUMX(
        ADDCOLUMNS(
            SUMMARIZE( Invoices, Invoices[Customer #], Invoices[Invoice Date], Invoices[Due Date], Invoices[Order ID]),
                 "Total Aging", [Receivables Grouping by Invoice Date]),
        [Total Aging])
This measure can be used in the reporting, for the calculation itself the “Receivables Grouping by Invoice Date”-measure is required.
For further information, see the link at the bottom.
Just only for your information, I have made some alternative measures, with the EXACT same outcome, which can be found in the measure group ZDS, where DS Total Paid, DS Payment Date and DS Outstanding Invoices differ from your measures.
About the graph, not giving aging history, I might have a disappointing response:
The calculation of aging reporting is completely based upon ONE single date, which is set by the time slicer (like 11.05.2021).
Other dates, as intended to be used in the graph, does not provide any context for aging calculation (given 11.05.2021, how should this aging calculation give an outcome for 19 March 2021) ?
Storing of measure aging calculations is not possible, and creating calculated columns or tables not an option.
If aging with only 4 historical periods will meet your request of aging development overtime, a solution might be (not tested, but should work):
extend the Calendar table with 4 columns, with column names like DatePrevMonth, Date2MonthsBack, Date3MonthsBack and Date4MonthsBack, each dynamically connected to the Date (like something of PreviousMonth = ‘Calendar’[Date] - 30)
makes 4 new sets of aging measures for each new period, connecting the 4 new “Selected date”, “Due Date” and “Payment Date” with the new column dates
be aware that the report can become (very) slow with those additional measures
If not using the above option, the graph is in my opinion only possible for the slicer selected day.
This is fantastic. I was so close! Thank you for your detailed explanation.
One follow up question in regards to the line graph. In Sam’s example (attached) I added a new tab (Graph) then added his measure to a line graph. I am able to get the trend lines to show up and they match the underlying data from the other tab.
I was hoping to accomplish this, but I am getting the same results that you get in the above pictures.
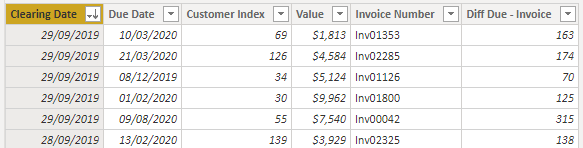
Looking at the formulas used by Sam, all rolling invoices and aging are based upon difference between Clearing Date and Due date, all invoices has an “Due Date”.
His invoice table does not have a date for invoices paid, so I think that “Due date” is meant to be Payment date or Invoice write off date.
You could quickly look in the invoice table, using a calculated column, for the days between clearing and due date : Diff Due - Invoice = DATEDIFF(Invoices[Clearing Date], Invoices[Due Date],DAY), this is the AGING (see also the formula “Days Left”)
With your data, the final “due date” = paid/written off is not known yet, that making rolling forward of invoices an issue. Maybe it is possible from paid invoiced in the past, to define the historical aging, according to the method above ???
What is exactly the definition of “Due date” within the database of Sam ?
I set the due date to the invoice date + 2 days. The difference between my model and Sam’s model lie in the payment date. Some of the invoices have a payment date (if paid) and some of them are blank (if unpaid). The unpaid invoices then need to be dynamic and use today for aging purposes.
In addition, if payment date is > selected date, paid invoices need to move from paid to unpaid and age based on datedif(invoice date, selected date, day). If payment date is < selected date, invoice is marked paid and is removed from the equation.
What I have now is very helpful (thank you), but I also need the ability to see if the team is improving payables.
Just my thoughts about your comments/ summary of your thoughts:
I think that “Due Date” in the formula of Sam should be replaced by “Payment Date” out of your “Invoices-table” and if no payment is made on a invoice, use “today” as you propose.
Ignore completely the “Due date” you are using.
You will get rolling invoices value , due to the fact that the invoice value is affected by the formula “Days Left”.
With using all formulas from Sams example will then give numbers.
Days Left =
IF( AND( [Invoice Date] < [Selected Date], [Due Date] > [Selected Date] ),
    DATEDIFF( [Selected Date], [Due Date], DAY ),
        BLANK() )
I have made a workout of an Aging Reporting as discussed yesterday:
See also PBIX attached: AR Aging conform EDNA method.pbix (1.1 MB)
The aging reporting is 100% calculated according the methodology in the AR aging reporting example as explained by Sam McKay
Due Date as used in the example is “Payment Date”, or if no Payment Date, “Today()”
Invoice Date as used in the example is “Due Date”, being 2 days after the “Invoice Date”
The tables should no be connected in the data model
Three reports are created: an Aging graph, an Audit report and a Aging table.
In order to calculate correct totals, an “Total Receivables” measure is added, which is to be used in every report.
Aging of Non-paid invoices, which have a payment date of “Today()”, might need a second thought, as it exists of a mixture of the most recent invoices and elderly invoices not being paid yet.
I have a question here with days left in Accounts Receivable module. After I watched Sam’s video, I realised that the aging in the video was about how many days left still till the due date from selected date. How about I would like my AR module to show overdue days? What I would like my bucket to be are “not due yet”, “overdue 30days”, “overdue 60 days”, “overdue 90 days” etc.
So in Sam’s Dax for Days Left, for my overdue days obviously my due date cannot be greater than the selected date. What will the DAX be in this case? Is the selected date DAX still the same?