Hello, I have implemented an Income Statement report based on the Financial Reporting tutorial and would like to be able to dynamically display multiple columns at the same time, selected by filter with “multiple selection” turned on, ie diplay both actuals and % of revenue side by side. I have a total of 5 options I would like to dynamically control: CY Actuals, PY Actuals, % Revenue, $ Change and % Change. This currently works if one item is selected, but if multiple are selected it is blank, which I think makes sense based on the SWITCH / TRUE logic.
This isn’t that hard to implement, but I find the setup for it not particularly intuitive. Here’s an excellent short video that explains exactly how to do it:
Hope this is helpful.
- Brian
Thanks Brian, this is the functionality I want, but in my case, I am trying to dynamically change the values which are measures and not coming directly from a table.
1 Like
That clearly increases the degree of difficulty on this, but I still definitely think it’s doable. Can you please post your PBIX file so we can play around with some different approaches?
- Brian
Hi Brian, if you look at the Financial Details page of the Financial Reporting tutorial, this is essentially what I have. This sample file lets you choosed between “Actuals”, “vs Last Year”, and “% to Revenue” along with quarterly data, but only one selection at a time. I would like to view any of these simultaneously by changing that slicer to allow multiple selections.
OK, this was a fun one to work out - I think I finally have a solution that meets your requirements. Here are the steps:
-
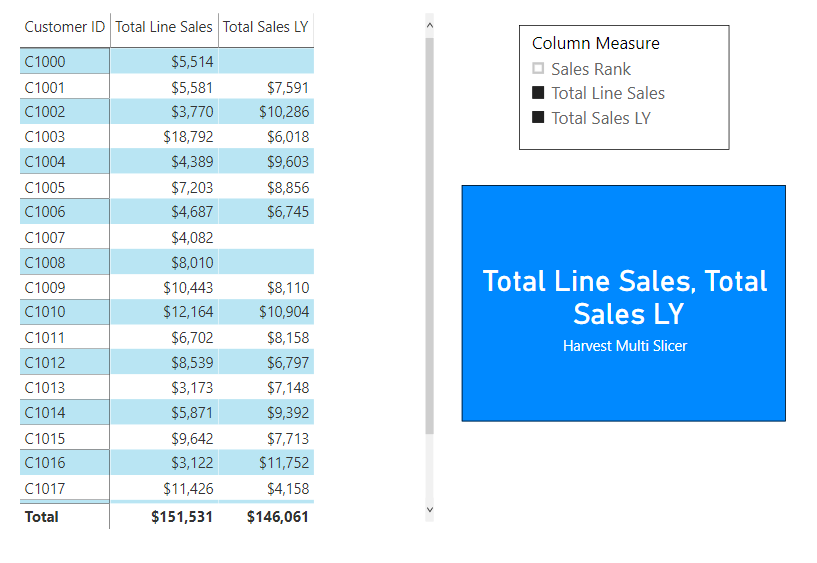
harvest the results of the multi-select slicer using CONCATENATEX( )
Harvest Multi Slicer = CONCATENATEX( ALLSELECTED( 'Dynamic Columns'[Column Measure] ), 'Dynamic Columns'[Column Measure], ", " ) -
Using CONTAINSSTRING ( ), create dynamic versions of the measures you want to turn on and off where if they are not selected in the slicer they return BLANK( )
Total Sales LY Dynamic =
 IF(
     CONTAINSSTRING( [Harvest Multi Slicer], "Total Sales LY" ) = TRUE(),
     [Total Sales LY],
     BLANK()
 )
Now if Power BI allowed you to hide blank columns the same way it does blank rows, we’d be done here. However, if you put these measures in the matrix and click the slicer on and off, the values will disappear but that header will still remain, which looks terrible. So we’ve got a few more steps…
-
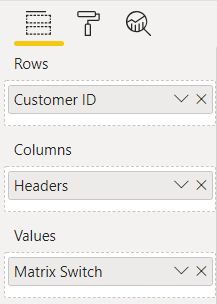
Create a separate one column table containing your matrix column headers (could just be the names of the measures you want to include in your matrix)
-
Create a SWITCH( ) statement for the values in your matrix, using the header values created in 3) above:
Matrix Switch =
SWITCH ( SELECTEDVALUE ( 'Matrix Column Headers'[Headers] ), "Total Line Sales", [Total Sales Dynamic], "Total Sales LY", [Total Sales LY Dynamic], "Sales Rank", [Sales Rank Dynamic] ) -
Now populate your matrix visual as follows, using the elements created above:
- Click the down arrow next to Headers in the Columns well, and make sure the option “Show items with no data” is UNCHECKED.
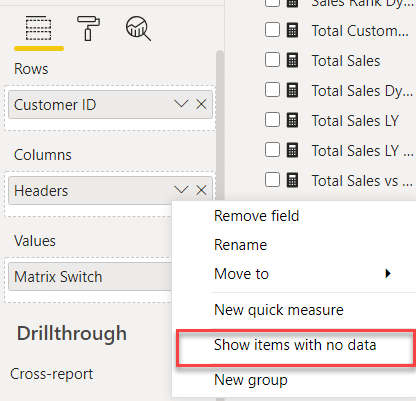
And Presto! Now your matrix columns should be totally dynamic, based on the multi-select slicer.
I hope this is helpful. Full solution file posted below.
Works great, thanks for the solution!
Great solution Brian. Amazing work on this one
Sam
Thanks – I really appreciate that. As I said, this was a really interesting problem to work through start to finish.
For anyone using this solution, there are two subtle caveats that you’ll need to address in your specific implementation:
- In your disconnected table that contains the measure names used in the multi-select slicer, you cannot use the typical naming conventions that we use for measure branching, e.g., “Total Sales” and “Total Sales LY”. This is because of the way the CONTAINSSTRING function works. The following statement:
CONTAINSSTRING( [Harvest Multi Slicer], “Total Sales” )
will return TRUE for both Total Sales and Total Sales LY if the former is selected, whether the latter is actually selected in the slicer or not. This is why in the solution posted, while I have a measure called Total Sales, in the slicer I refer to it as Total Line Sales.
- In the matrix visual, because all the of dynamic column values are controlled by the Matrix Switch measure, they cannot be individually formatted - thus you have to pick a format for the entire measure that makes sense for all of your individual columns. I actually updated the solution file to use a general number format rather than a currency format, which was inappropriate for the Sales Rank column.
I initially thought I could solve this problem by wrapping each column measure within the Matrix Switch measure in a custom FORMAT statement. Unfortunately, when you do that it prevents the headers from disappearing dynamically.
I don’t think either of these are major problems if this dynamic column selection capability is something you want in your report, but just wanted you to be aware of them.
- Brian
Brian, I have been looking at this a bit more and found a workaround for Issue 2 that you pointed out above. If you use an IF to format only for non-blank values, the dynamic column functionality still works. Here is an example which formats Total Line Sales as %.
  Matrix Switch =
    SWITCH (
        SELECTEDVALUE ( 'Matrix Column Headers'[Headers] ),
        "Total Line Sales", IF( [Total Sales Dynamic] = BLANK(), BLANK(), FORMAT( [Total Sales Dynamic]/100, "0.0%" ) ),
        "Total Sales LY", [Total Sales LY Dynamic],
        "Sales Rank", [Sales Rank Dynamic]
A couple of other issues have come up for me. First, the column subtotals don’t work which I haven’t been able to figure out. I have a feeling that this may be difficult to solve, but maybe I am missing something. Second, I have been trying to add another hierarchy level on the columns which works fine if I add it manually to the Columns Values in the Visual, but I would like to be able to add and remove that level dynamically as well. Here is a screenshot of what I have:
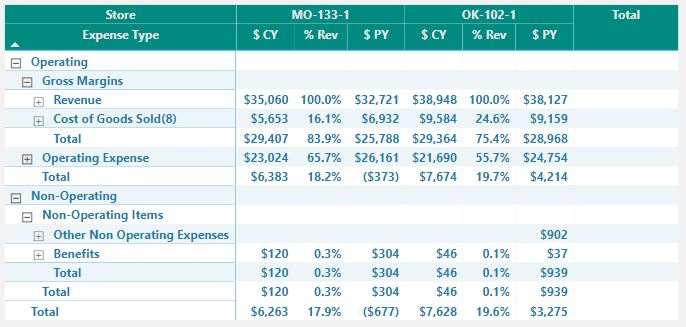
Is there an easy way to add this extra layer? The calcs should be the same, it should just be adding the location field to the column hierarchy dynamically.
Thanks!
1 Like
 - really clever fix on the formatting issue.
I’m glad to keep working on this to try to address the hierarchy and subtotals, but I agree with you that these are probably both nontrivial fixes. Thus, it would be really helpful if you could post your PBIX file, so that I could start from the point above on these two issues.
Thanks.
- Brian
Brian, thanks again for looking at this. I was able to get the Total to work if just one of the matrix switch items is selected by adding a BLANK() for the ELSE case of the matrix switch measure. If more than one is selected, a single total doesn’t make any sense. It would be nice to have the same hierarchy for the total column as for the store number, but as mentioned above, that might be a tall order.
I have not been able to make any progress in adding the location field to the column hierarchy dynamically. If I can get this working, then the Total issue above is somewhat moot, since I could just turn the store grouping off and see the total that way. I am attaching a scaled down version of my pbix file as requested. There is a selection in the upper left hand of the title bar with Store/Month/Quarter/Year which I would like to single-select and add that to the hierarchy. The pbix as is has the location added manually. I appreciate the help.
P&L Report.pbix (835.0 KB)
Brian - Just following up on this…I think I have a solid solution to the totals and turning the location hierarchy on and off. I am just lacking the next layer of month/quarter/year (those selectors don’t do anything in this file). Leaving Store unselected in the upper right displays only totals for selections from the store list. If Store is selected, then the store columns show up for any selections from the store list and the total is still displayed in the last column. This is the functionality I wanted.
BTW, I noticed I don’t have any PY data in this file so the PY, % Ch and Ch are not showing any data.
P&L Reportv2.pbix (834.7 KB)
Sorry for the slow response - I’ve been totally swamped at work this week, but it seems like you’re making great progress on your own. I’ll take a look at the remaining time layer issue and get back to you soon.
- Brian
No Problem, think I got it. I am not sure if this is the most efficient way to do it, but I have all the functionality now.
P&L Reportv4.pbix (814.7 KB)
1 Like
Really nice work on this. I learned some very cool tricks from what you built on top of my original solution. Also, really like the aesthetics of your report, and the way you’ve set up your slicers. Good stuff.
- Brian
Brian - thanks for the feedback and help along the way.