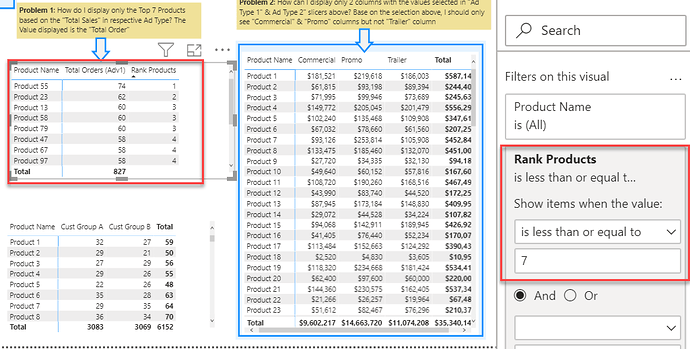
Q1: Create a RANKX-based measure to rank Products based on [Total Orders Adv-1], and then set a visual-level to show only Rank <= 7.
Rank Products =

IF( HASONEVALUE( Products[Product Name] ),
    CALCULATE(
        RANKX(
            ALL(Products),
            [Total Orders (Adv1)],,
            DESC,
            Dense
        ),
        ALLSELECTED( Sales[Ad Type])
    ),
    BLANK()
)
Q2: You’ve hit on one of my pet peeves about Power BI - while it’s very easy to dynamically hide rows in a matrix or table, it’s really difficult to do the same for columns. @jcgrigsby and I worked out an approach last year that may work for you here. If this doesn’t work for your particular case, let me know – I have some other ideas about how to do this, although aesthetically they’re not ideal.
Hope this is helpful.
• Brian
