Hello,
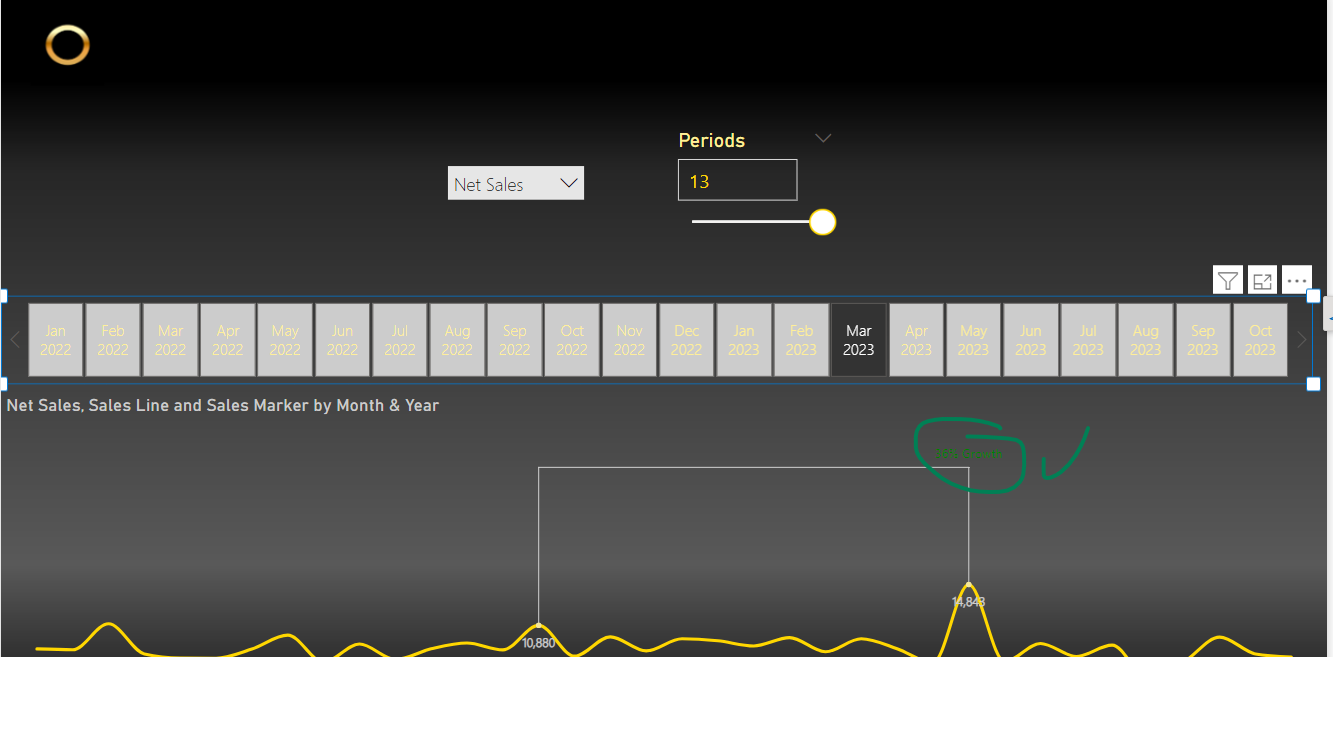
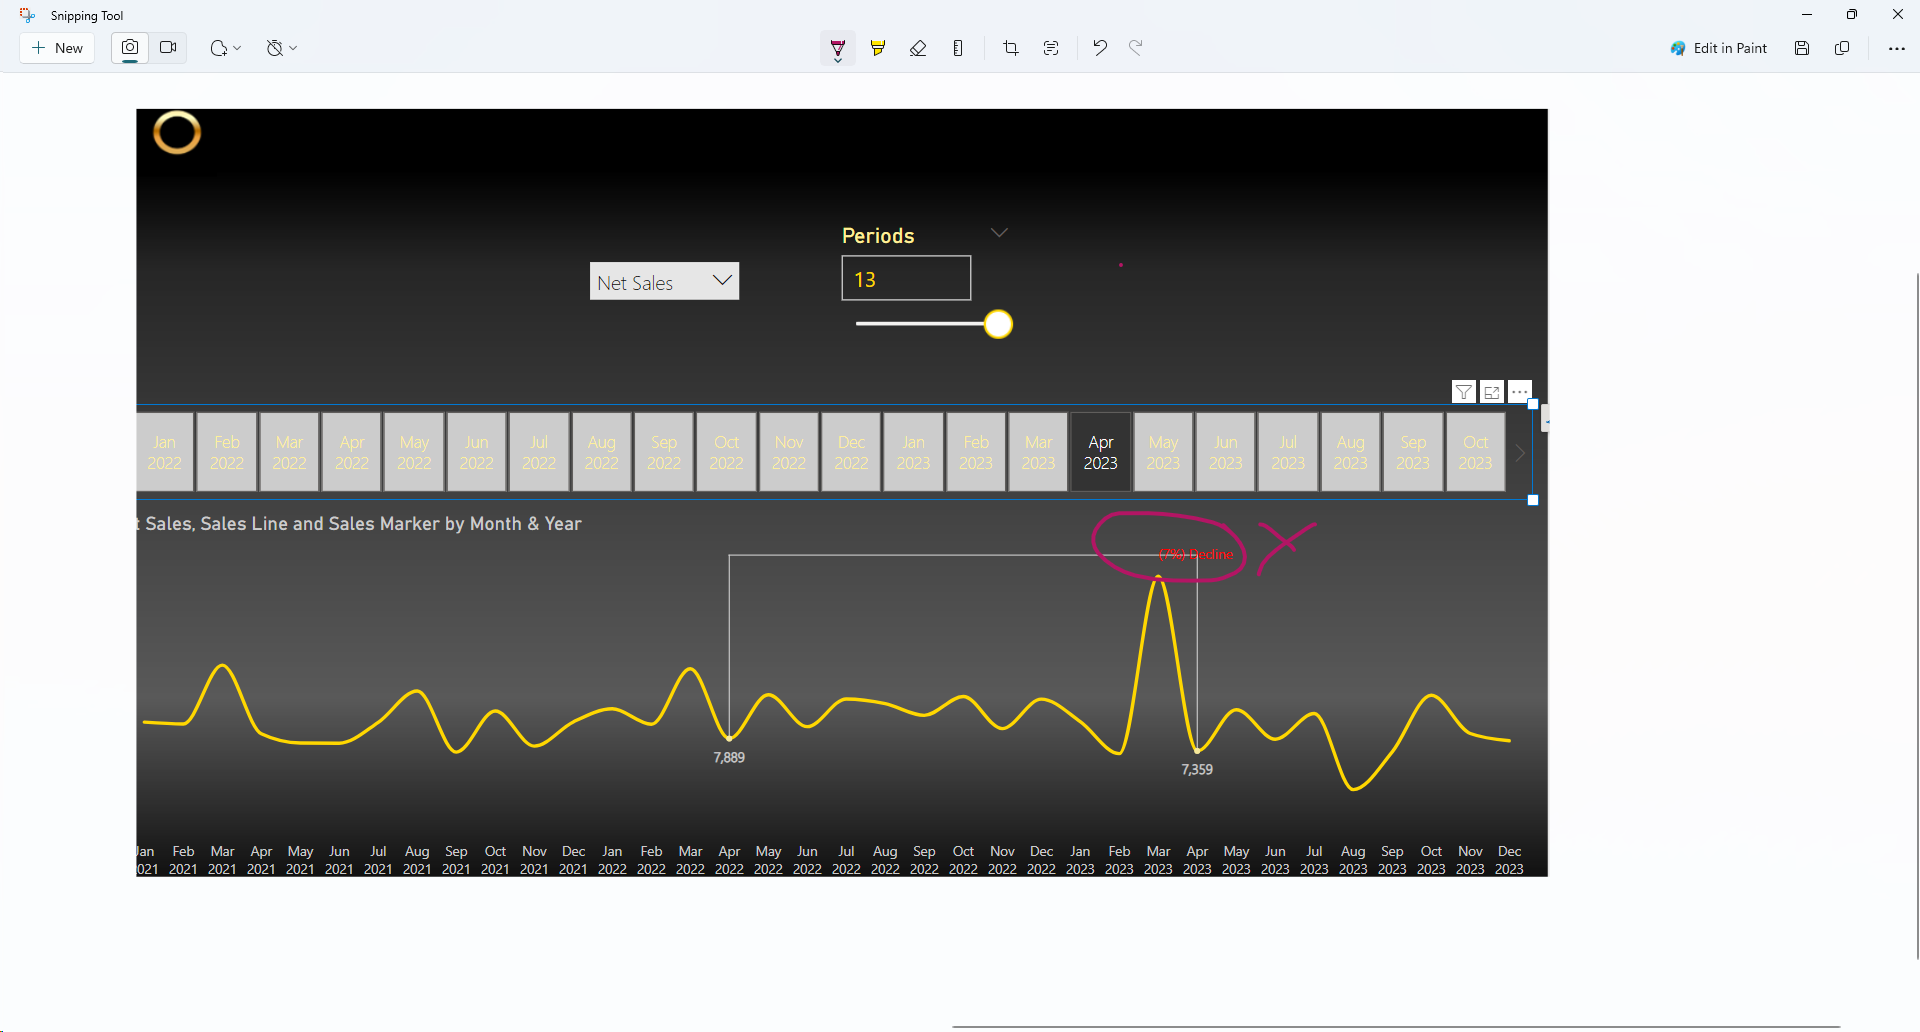
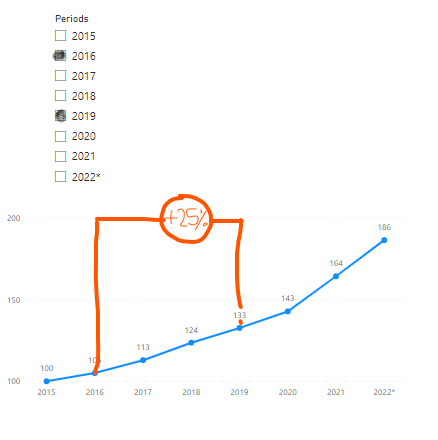
I want to creat something like this below (in red) on my line chart. The percentage change and the connecting line will change based on the selected value in year slicer above.
for forum_perct. change.pbix (33.6 KB)
Hello,
I want to creat something like this below (in red) on my line chart. The percentage change and the connecting line will change based on the selected value in year slicer above.
for forum_perct. change.pbix (33.6 KB)
@rmehta2650 Hello I would be more than happy to look into this. I have done something similar and was going to present it as one of my DAX Workouts. I have the file but also Goodly did a video on this which is excellent. It is based on @Gustaw’s work and he explained it.
Go check it out and I believe it will help you.
Let me know if you have any questions.
@rmehta2650 hey there. Any luck?
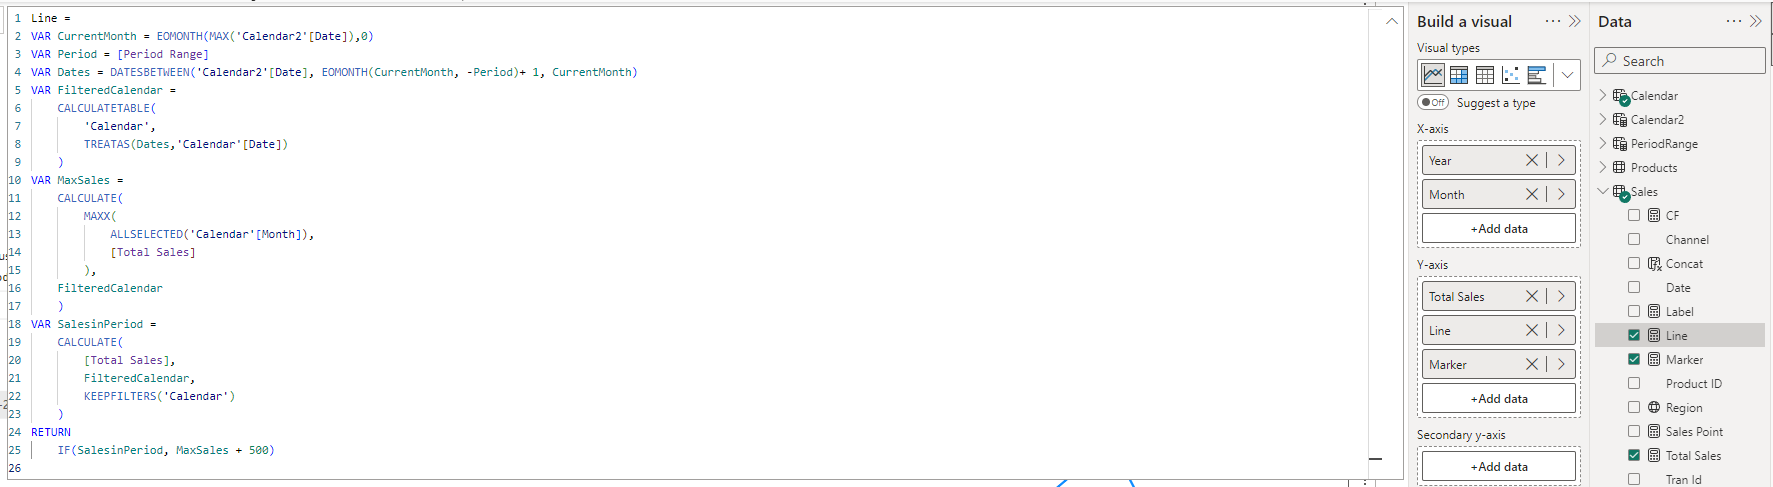
Anyway, if not, you will want at least two DAX measures. One for the line and one for the marker.
Marker = IF([Sales Point], [Total Sales])
The rest is formatting and a Sales point measure to be used in the error bar formatting of the line chart.
Reach out if you need more help along the way
Paul
Hi @Paul.Gerber, thank you so much for pointing us to the makeover video Goodly did. Fortunately I was able to replicate the same behavior.
However, I’m struggling to make this insightful line chart more dynamic based upon parameters so I can switch among different measures like Sales, Profit, Units and Orders. I created the same formulas for each, then next step would be to create a dynamic calculation (here’s where I am a bit lost) that is flexible based upon Unit of Economics selected (Sales, Profit, Units and Orders).
Also, the label showcasing the Growth and/or Decline is not always being displayed as expected, sometime it overlaps with the line:
Any advice on how to recreate this?
Thanks a lot,
Samuel
MyWorkingsShared2.pbix (1.1 MB)
HI Paul ,
I wonder if it would be possible to kindly request pbi file with this solution ?
Thank you ,
Iwona