Data Visualization Workout 003 - Service's Profit Analysis (Timelines)

Workout 003 – Profitability – Line & clustered column chart
Difficulty rating: 3 out of 5

Intro note
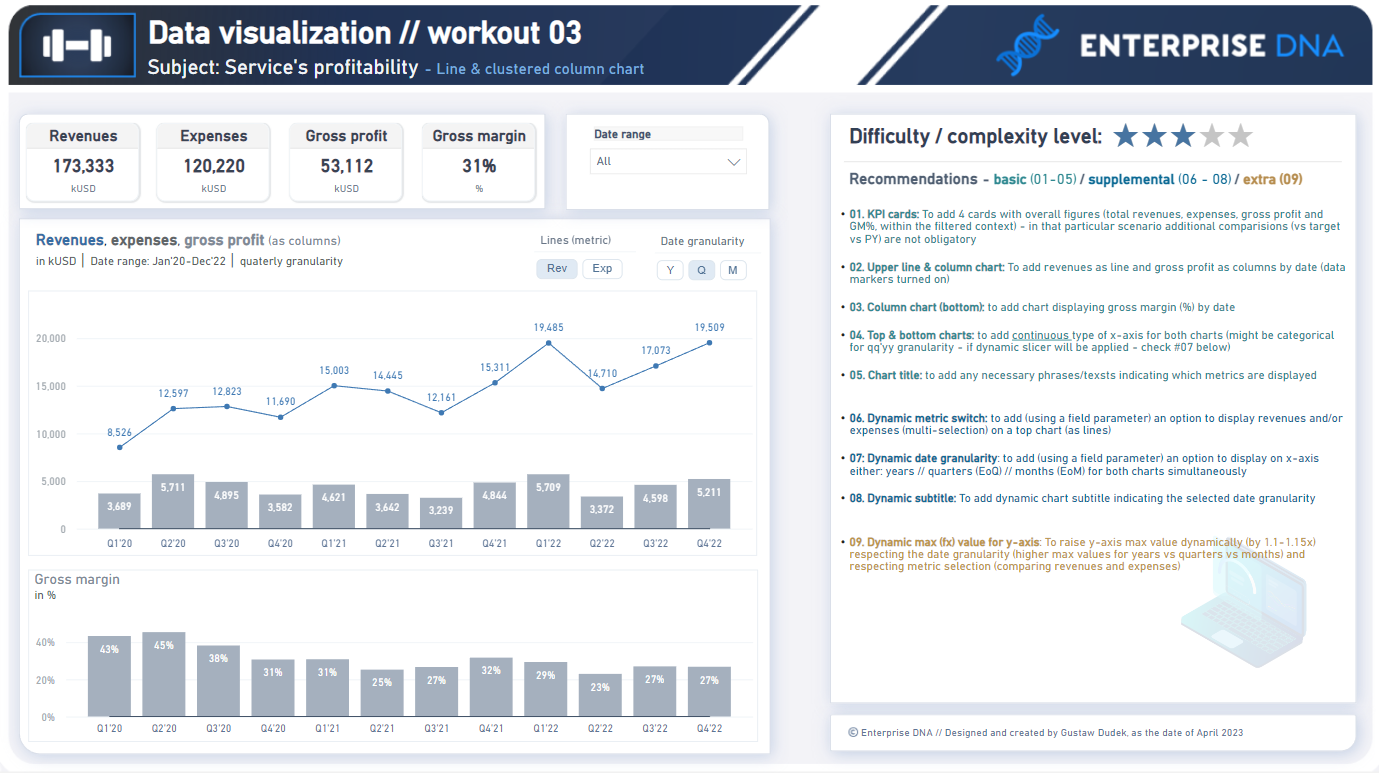
This workout combines various visualization techniques and native functionalities (i.e. field parameters etc). The most important part of the workout is practice - **entries does not have to include every element or functionality to be still considered as great **. Please pay attention to the list of functionalities (provided in the screenshoot), which includes ‘basic’ elements (1st-5th points), and supplemental (6th - 8th points) as well as one extra (9th point) - that can be more time-engaging.

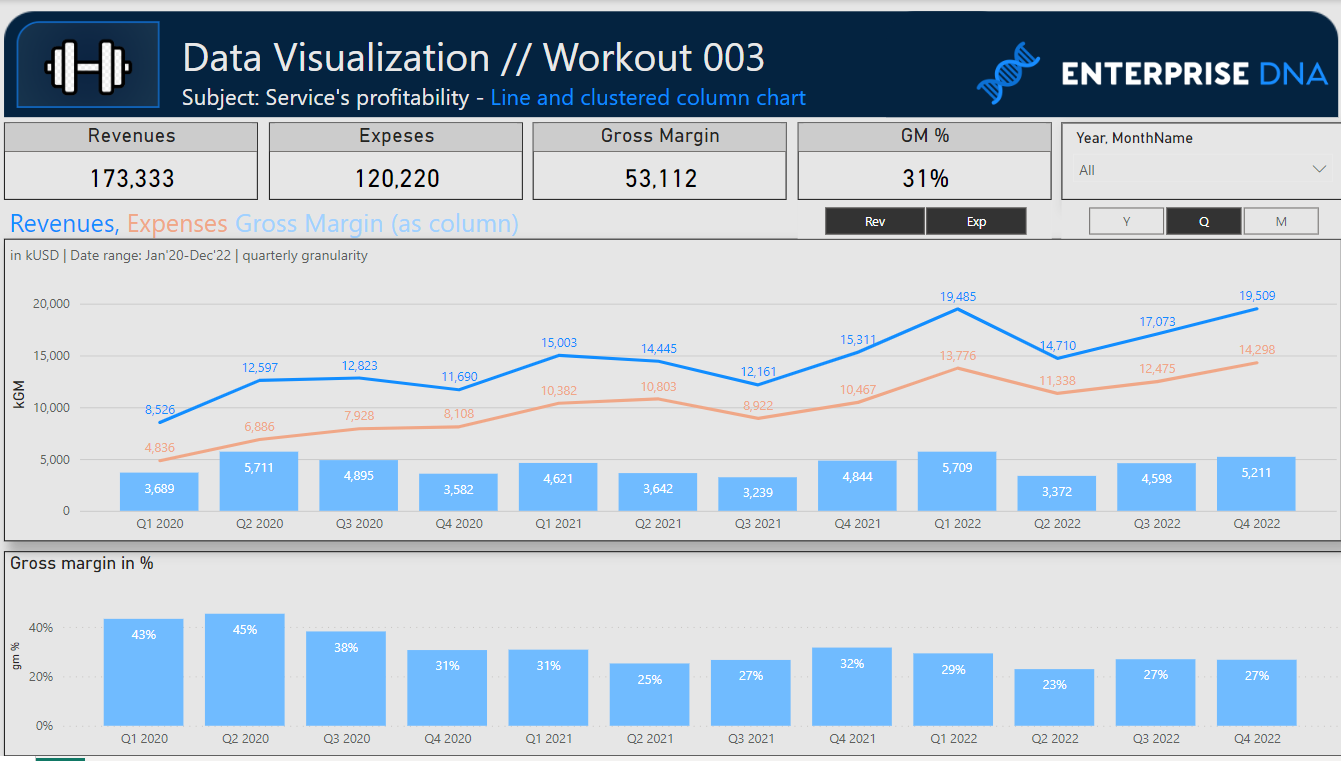
A good starting point is to implement two separate charts (top and bottom, where the top one displays gross profit and revenues and bottom one displays gross margin as the percentage). From there - it can be beneficial to add dynamic granularity, dynamic subtitle and dynamic metric selection (revenues and/or expenses)

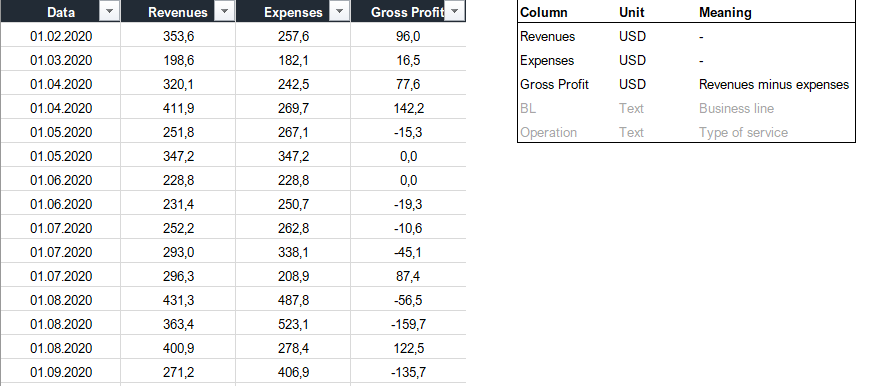
Following workout requires to use only 4 columns from provided dataset (date, revenues, expenses and gross profit). There are a few additional columns that are not implemental in the solution.
Nevertheless, please feel free to use any columns and any data which is valuable from your perspective. Feel free to use your entries as a part of your project portfolio.

Goals

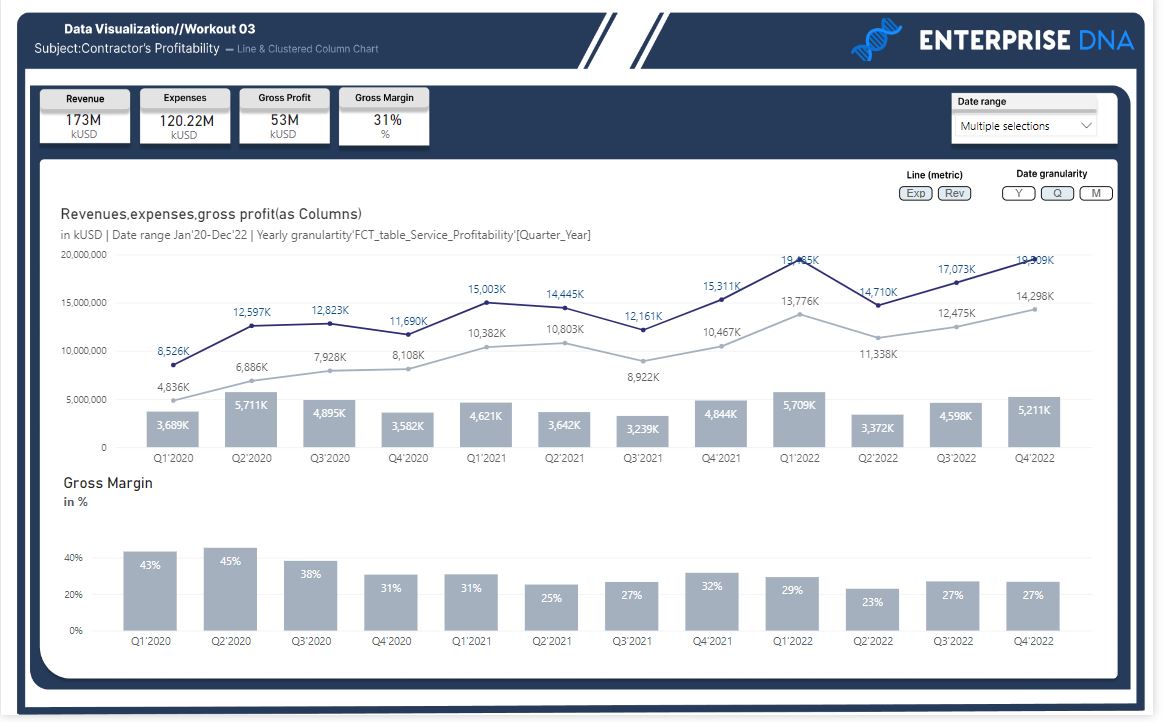
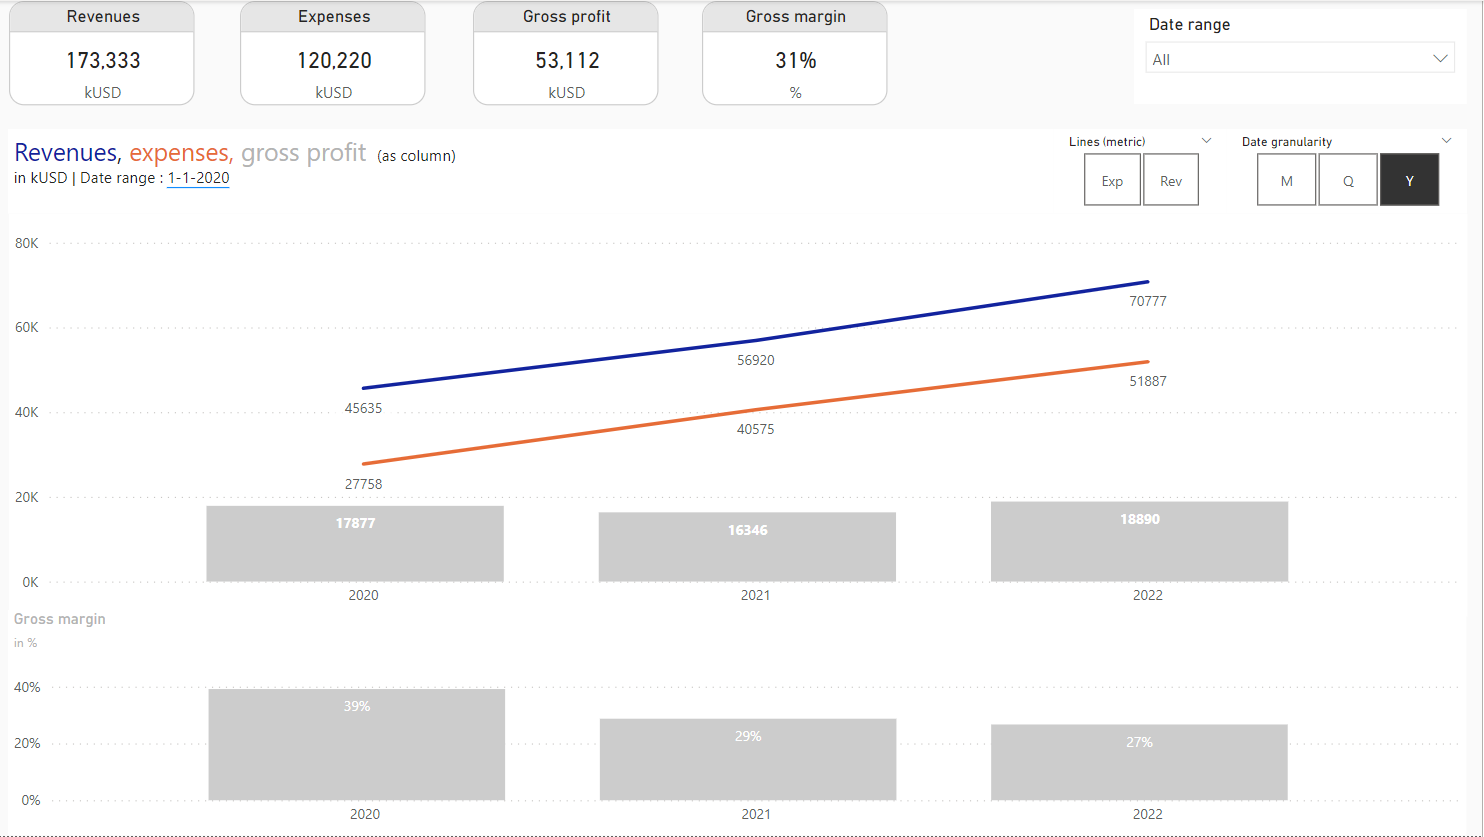
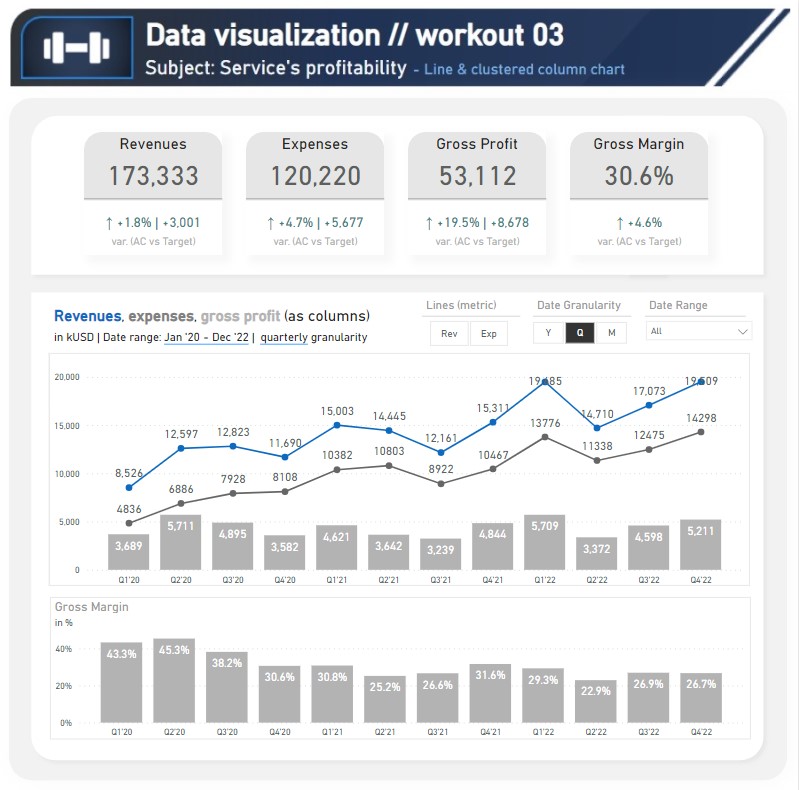
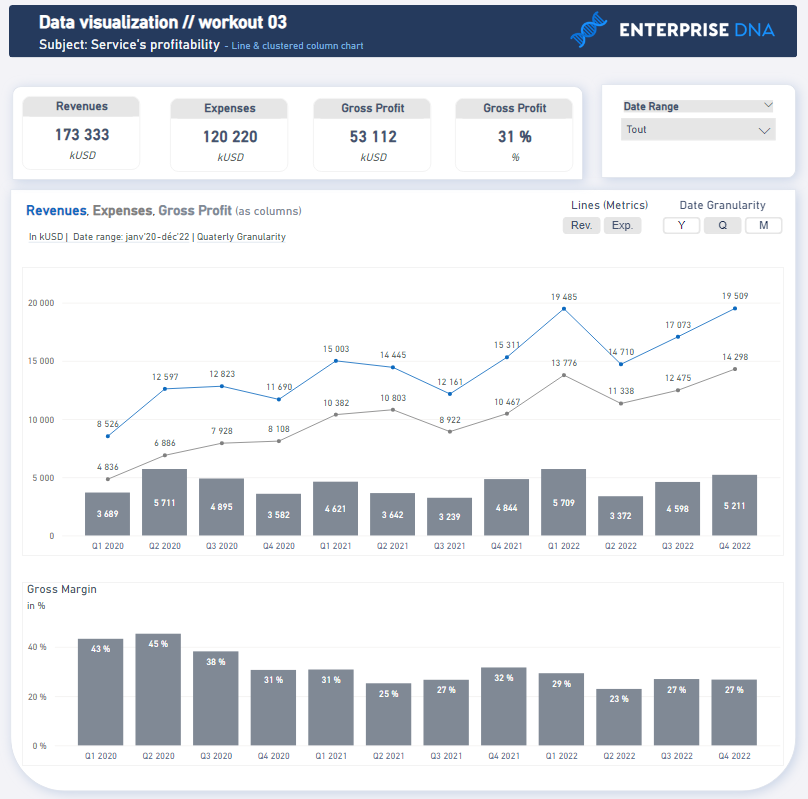
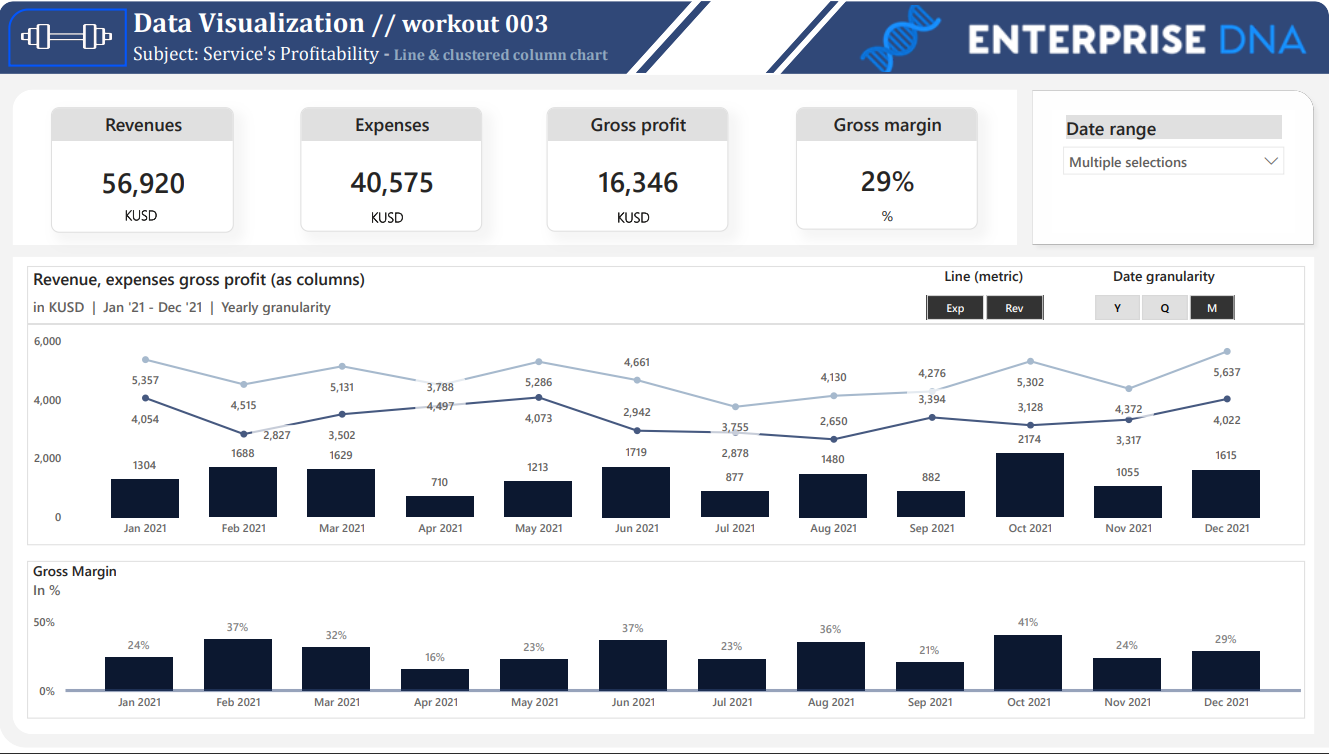
In this workout, using the supplied dataset we are going to replicate the following set of vizualizations (left section in a report screenshot), including the kpi cards, line & clustered column chart, column chart and additional slicers (some of them are built using custom visual “chiclet slicer”). Also, please feel free to add any extra visual if you would like to (provided that core visualizations are included in the first place).

003 - Workout - Services Profitability.xlsx (924.6 KB)

Core actions (practice) :

    • Making basic calculation (gross margin)
    • Getting familiar with column chart in general
    • Handling necessity to display multiple metrics at once (separating visuals)
    • Using dynamic date granularities
    • Handling data label formatting options (density etc.)
    • Creating informative texts (titles / subtitles)

Submission

Please load the supplied data (xls file) into a new Power BI file, replicate visualizations (considerating list of points in the introductory report screenshot), and reply to this post including the screenshot (or a gif) of your solution along with the pbix file (please, include name or EDNA forum nick in the pbix name).

Period

This workout is released on Tuesday April 11, 2023, and the author’s solution will be posted on Monday/Tuesday April 17-18, 2023.

Additional notes
Link to the interactive dashboard:

Have a gret fun!

Best regards!

5 Likes

Let’s go Sir

3 Likes

@windler.nikki , Sure! Let me know if anything will need further explanation!

Best regards!

2 Likes

Continuously striving towards perfection, the work remains in a state of progress

4 Likes

Almost done. Unfortunately, I couldn’t create dynamic subtitles :frowning:

Workout 003 Profitability.pbix (246.0 KB)

1 Like

Thank you for the MAXvalue formula, as I am stuck on recommendation 8 of the workout.

But I would like to understand why you divide by 25, 60, 150.

Thank you.

3 Likes

My submission for workout 003.

Even though it wasn’t required, I decided to add AC vs Target comparison simply because I wanted to learn this amazing technique.
I’m thoroughly enjoying working on these workouts and improving my skills in this field. Thank you!

Thank you.

Service’s Profit Analysis - Workout 03.pbix (448.9 KB)

6 Likes

Unfortunately, it’s not working the way I want. :frowning: But I want to solve it this way, that’s why I left it like this until I find the correct solution. Maybe someone will find errors and help me to correct this formula. If not, we have to wait for Gustave’s solution. Sorry, I can’t help :slight_smile:

3 Likes

We will wait for Gustave’s solution. In the meantime, I used your formula because I had no solution to solve recommendation 9.
Thank you."

2 Likes

My submission for workout 003.

Always a pleasure to learn by your side.

Thank you.


003 - Service’s Profit Analysis (Timelines) Remi MARTINATO.pbix (424.0 KB)

4 Likes

awesome work naby :orange_heart:

4 Likes

Thank you, these exercises are an incredible opportunity to learn and be inspired by other participants.

2 Likes

Hi
I, really enjoy these workouts. Here is my submission for W003.
Workout 003_EDNA_AngelinaMihejenkova
Workout 003_EDNA_AngelinaMihejenkova.pbix (994.8 KB)

5 Likes

Nice Work.

2 Likes

Thank you! There is still work to be done :slightly_smiling_face:

2 Likes

Thank you :slight_smile:

2 Likes

Awsome Angelina

3 Likes

Hello Everyone,

@Gustaw not able to set up zoom based on selection Y axis, if you will explain that will be helpful.
Data Visulazation Workout 03.pdf (188.4 KB)

Here is my solution for the workout -03
Workou-003

3 Likes

Hi Gustaw,

Thanks for another great workout. I have completed everything except #9. I also
spent some extra time with the KPI card to practice using the new subtitles.

Workout Ch3 LineColumnChart v1 Kim Cook.pbix (570.9 KB)

4 Likes

Hi,
thanks for the great opportunity to improve our skills in such a way !
I am paying more and more attention to details !
Said that, I think I found a way to solve point 9 !
so… please find attached my pbix.
ciao !


Roberto Ravani - workout 003 - Service s Profit Analysis.pbix (436.5 KB)

3 Likes