Hello,
I learned from watching a number of videos by Sam and DNA Enterprise how to create dynamic calculations using a category table, combined with SELECTEDVALUE and SWITCH statements to toggle between different measures such as profit, costs, margin, etc, but this involves creating multiple measures and then assigning them to the SELECTEDVALUE choice.
I put together some sample data to illustrate the situation I am trying to tackle.
I have a number of fact tables, probably more than five or six with maybe 40+ tables in my data model. One particular fact table holds revenue and margin data. I’m trying to determine if there is a way to write a calculation to substitute a different date column into a CALCULATE and USERELATIONSHIP measure to avoid having to create multiple measures for each.
I have many measures, and would need to create three measures for each aggregation. As you can imagine there are multiple aggregations that are used to determine a gross/net margin and I’m trying to avoid creating multiple measures for each aggregation.
Is there a way to use a date column in a USERRELATIONSHIP function to dynamically change the context of the measure to avoid having to create multiple measures?
In my in my fact table I have three dates: Order Date, Ship Date and Delivery Date. I randomly created this data – so feel free to use it as a template for random data generation. I created a random Order Date that ranges from 1/1/2020 through 12/31/2022. I then created a random 6 digit customer number between 900000 and 999999; I created a random 5 digit product number from 50000 and 60000; and created a random quantity and price (I’m now realizing I might have the same product with different prices, so the data might have some integrity issues). I then multiplied quantity and price to get an extended price, and then created a random Ship Date based off the Order Date ranging from 1 to 14 days after the Order Date, and created a Delivery Date based off the Ship Date ranging from 0 to 7 days. (Formulas start on the 3 row in the excel file tab labeled random, and I copied and pasted values to the hard-coded tab for the report).
I created 3 inactive relationships between the Date Table (Compliments to DNA Enterprise and all of its contributors) and my sales data.
I then created my aggregated sales measure and three additional measures for each date type.
Total Sales = SUM( ‘Sales’ [ Ext. Price] )
Sales by Order Date =
CALCULATE( [Total Sales],
USERELATIONSHIP( Sales[Order Date], ‘Date’[Date] ) )
I then created the other two measures for Ship Date and Delivery Date, and put them all in a table called “Key Measures”.
Then, I created a table with an index to serve as my slicer, with “Order Date”, “Ship Date” and “Delivery Date”.
Next, I created a measure to link the table to my SWITCH statement.
Selected Date Type = SELECTEDVALUE( ‘Date Selected’ [Date Selected], “Order Date” )
Finally, I built the measure to serve as the dynamic measure I would use in my visuals.
Sales by Selected Date Type =
SWITCH( TRUE(),
‘Date Selected’[Date Selected] = “Order Date”, [Sales by Order Date],
‘Date Selected’[Date Selected] = “Ship Date”, [Sales by Ship Date],
‘Date Selected’[Date Selected] = “Delivery Date”, [Sales by Delivery Date] )
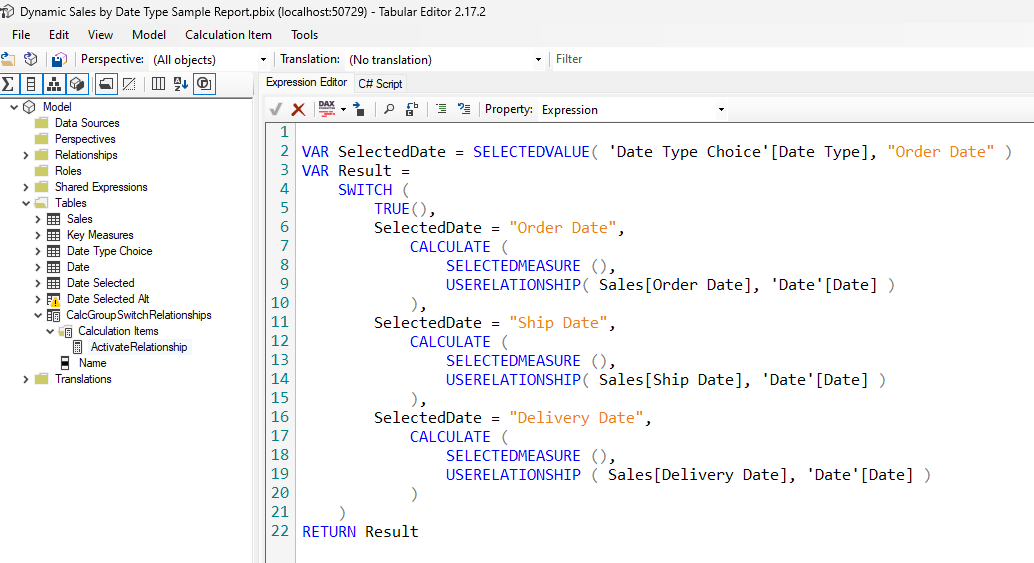
I’m wondering if I can do the same but using the Date such as:
Sales by Date Type Alt =
CALCULATE( [Total Sales],
USERELATIONSHIP( “Date by Selected Type”, ‘Date’[Date] ) ) // This "Date by Selected Type allows the ability to toggle the Date type to dynamically altering the relationship used to calculate the measure.
And then using a SWITCH statement such as:
Date by Selected Type =
SWITCH( TRUE(),
'Date Selected '[Date Selected] = “Order Date”, “—Order Date Column—” , // This being the date using the Order Date
‘Date Selected’[Date Selected] = “Ship Date”, “—Ship Date Column—”, // This being the date using the Ship Date
‘Date Selected’[Date Selected] = “Delivery Date”, “—Delivery Date Column—” ) // This being the date using the Delivery Date
The goal behind this attempt is to minimize the number of measures I need to create, in hopes to minimize the file size and have the least impact to performance as possible (If there are any gains).
Attached are my sample data and my pbix files. The SWITCH measures are grouped into tables called Date Selected and Date Selected Alt.
Sample Sales Data.xlsx (24.0 KB)
Dynamic Sales by Date Type Sample Report.pbix (223.1 KB)
Thank you,
