I am down to the last request in my project and need a creative way to mimic a static manual chart.
Fully aware of some of the formatting limitations.
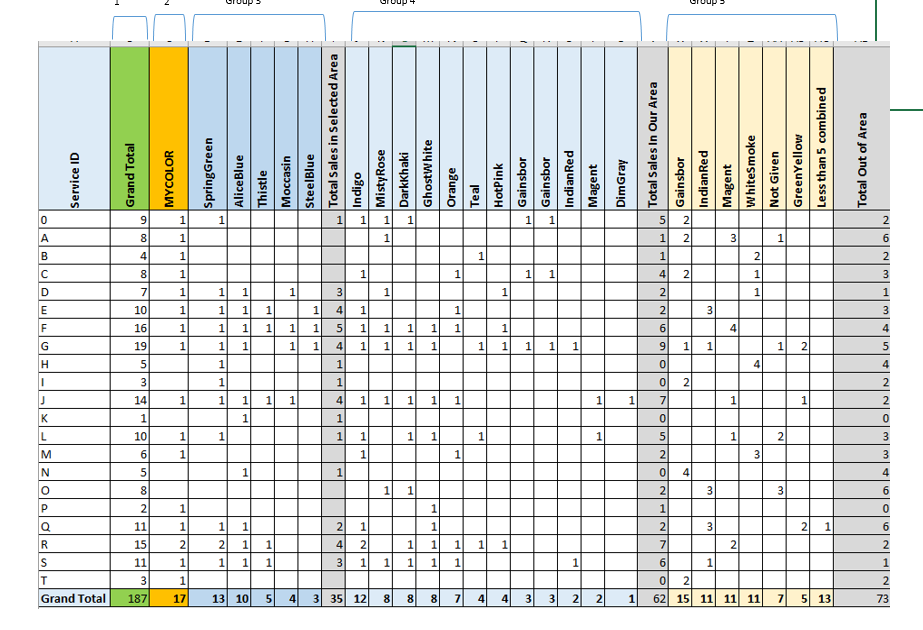
Requirements:
Area and Year, set via slicer
- Grand Total
- Total for MyColor
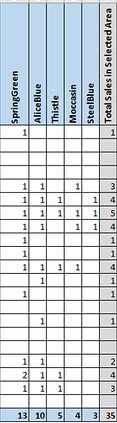
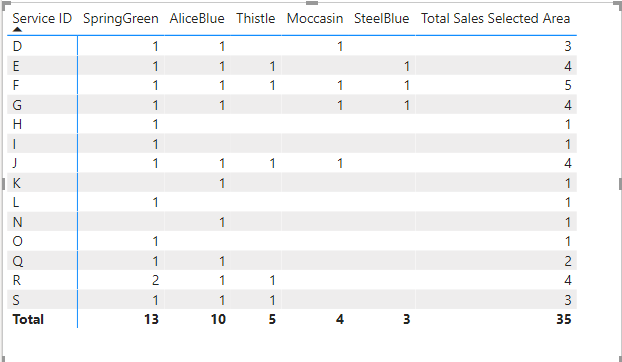
- Dynamic Columns for count in Selected Area
* Sub total for above
- Dynamic Columns for count in the total area (Those in area less the selected area)
* Sub total for above
- Dynamic Columns for the count outside of our area. If the outside area is less than 5 count, I need to combine that count into an “Other” column.
* Sub total for above
The columns should be ranked descending left to right.
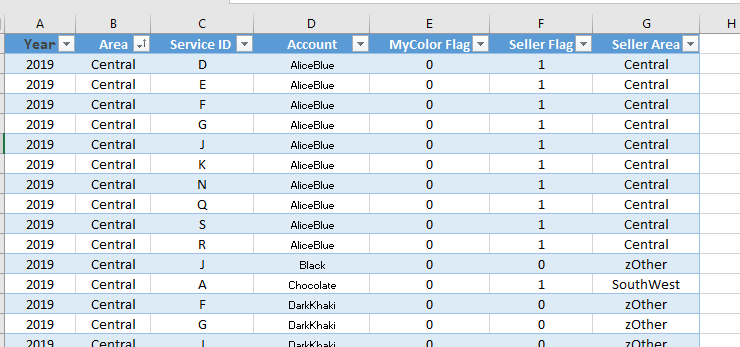
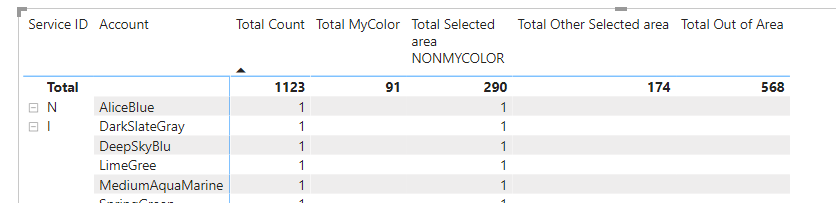
A view of my example dataset.
My Color flag is set to 1,0 (1 for MyColor count, 0 for do not count)
Seller Flag is set to 1,0 (1 for my area count, 0 for outside of my area count)
and an example data setData Prep.xlsx (100.0 KB)
Thanks for the assistance and learning opportunity!
@jhcoburn,
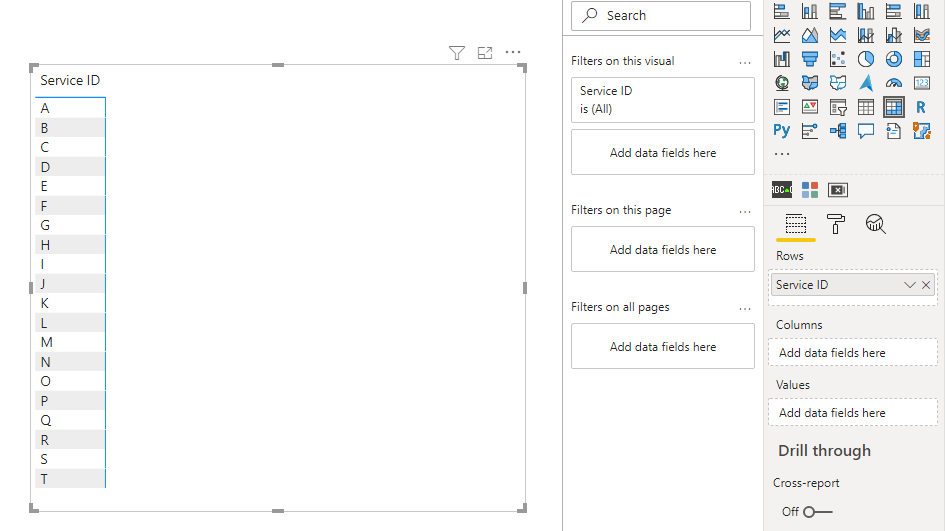
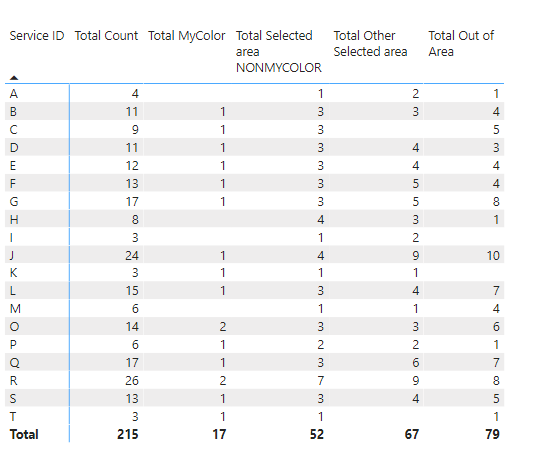
Should be able to accomplish this using the Matrix visual. Add your Service ID in the “Rows” portion, any all of your measures in the “values” portion. Try putting something together yourself, and if you have issue putting it together, post a PBIX file so we can better assist.
Thanks
Jarrett
Thanks for the quick reply, So I can get to my values for each of my requirements as the measure are correct for each requirement.
 .
.
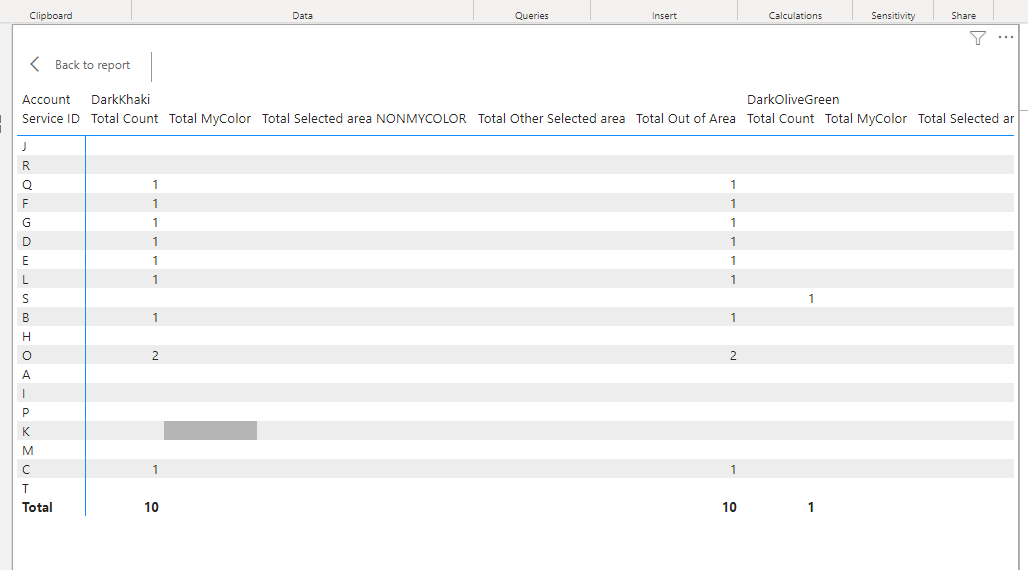
The problem occurs when the columns are added to incorporate the account names. The account names are repeated for each
I do not need the account field for Total Count or TotalMyColor
I also need the account field to follow the value, not the value to follow the account field.
For example,
Currently have
DarkKhaki Total Count, Total MyColor, Total Selected area NonMy Color, etc…
Need Total Selected , DarkKhaki, Total Other Selected Area, DarrkKhaki, etc…
Thanks (28.7 KB)
@jhcoburn,
You are correct in your thinking. Won’t be able to add the columns. One way around it would be to create a measure for each of column totals that you want for each of them. The other way to do this would be to use calculation groups if you are familiar with them. The PBIX file didn’t upload by the way.
Thanks
Jarrett
Data Prep.pbix (28.7 KB)
I am not implemented calculation groups, let me do some research!
Thanks
@jhcoburn,
I just duplicated this from your original post. This should get you headed in the right direction
Here is PBIX:
Data Prep v2.pbix (29.4 KB)
Thanks
Jarrett
1 Like
Jarrett, While that is a step in the right direction, that is probably prohibitive as my actual fact table distinct count for that field is over 6K and that field would likely increase in size each quarter. In addition, if the count is zero would not have it populated in the column. My team is introducing Power BI to leadership, so trying to think of some automation here and then tag that with manually manipulating tables is time consuming and can lead to errors.
Thanks for your input!
have you considered adding the account data to the rows section of the matrix?
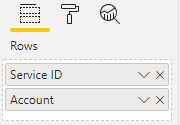
I also performed the following steps:
- removed the stepped layout (under Row Headers in the formatting pane)
- moved subtotals to the top of the visual (under Subtotals)
- turned on the “per row level” option in Subtotals formatting, and turned off the Account subtotal
- expanded the visual to the next level in the hierarchy

see attachedeDNA - adding additional data to matrix ROWS.pbix (28.8 KB)
Hi @jhcoburn, did the response provided by @Heather and @JarettMhelp you solve your query? If not, how far did you get and what kind of help you need further? If yes, kindly mark as solution the answer that solved your query. Thanks!
Thanks for the input Heather. All great suggestions. I will implement, format and call it good.
1 Like